About CreatorDB
CreatorDB is a web-based app that provides a comprehensive database service to brands, agencies, and other companies that need influencer marketing to find and match the most suitable social media creators for online ad campaigns. The database comprises millions of creators from mainstream social media platforms like YouTube, Instagram, and TikTok. Designed for any company that needs to find influencers, the database provides insight into creators’ performance, comparative metrics, the topics or niches they create content on, and much more.
What’s new
The following are the major new features and improvements in the latest version of the CreatorDB app. For details, go to https://creatordb.app/announcement/7948-2/.
2025.11.21
- Added scan by Share profile feature to the creator profile.
2025.11.19
- Added scan by importing file feature to Brand scan.
2025.10.19
- Added Views range, a new visual indicator that can help you get key video view metrics at a glance.
- Added more filters to the Instagram Discover page.
- Graphs support zoom-in and zoom-out features.
2025.09.19
- Added the Brand scan feature to help you search for a creator’s past sponsorship history.
2025.08.28
- Improved brand page user interface design to make it easier to view sponsoring brands.
- Improved data summaries and wording for better user experience.
2025.08.08
- Added YouTube audience demographic filters.
- Optimized user interface design.
- Fixed the views filter function.
- Fixed CSV file format upload issues.
2025.07.11
- Added API dashboard for tracking API credit usage and related metrics.
- Added YouTube audience demographic data for Content search.
- Added Instagram sponsored content data.
- Added the last content post date for YouTube, Instagram, and TikTok.
- Added the last data update date for each platform.
- Added the Active icon to indicate which platform creators have uploaded new content to within 30 days on the Creator Profile page.
- Added a chatbot for live assistance.
- Added link to CreatorDB’s help center.
- Added release notes link.
- Added a label to show the creator’s main platform.
- Improved design layout of Keywords and enabled multi-selection and organization of keywords.
- Improved the search engine feature to find more related results.
- Improved result table column organization and enabled drag-and-drop management.
- Enhanced wording on the user interface for better user experience.
- Improved readability of creator profile charts.
- Improved visibility of the Cancel plan button.
- Improved data display.
- Improved audience demographic data accuracy.
- Fixed creator profile display issues.
- Fixed various display and functionality issues for dashboards.
- Fixed trial cancellation issues and correct display of plan expiration dates.
Key terms
Brand
Refers to a company actively participating in the influencer market or sponsoring content.
Topics
On the CreatorDB platform, topics are content categories based on YouTube classifications. You can apply up to 470 topics to your filter conditions to narrow search results.
Niches
CreatorDB’s AI algorithm can identify up to 16,000 niches. These are more granular categories of a topic. For example, if birds are a category, then penguins would be a niche.
Self-like
When a creator likes their own content, the number and ratio of self-likes indicate whether their content likes are organic or self-promoted.
Application scenarios
CreatorDB offers a comprehensive database that provides millions of creators’ data. With extensive data on millions of creators’ content performance across major social media platforms, such as YouTube, Instagram, and TikTok, you can utilize data in the following ways:
Finding the right creators for collaboration
The CreatorDB platform is excellent for finding creators to promote your products to new market domains and expand your presence in these regions. You can search for creators by more than 50 filters like location or language to find the most relevant creators that meet your company’s targeted markets—or sort creators by content type to better position your online campaigns. CreatorDB’s database allows you to find creators that fit your brand image and helps you assess whether they would make good brand ambassadors. Detailed content statistics provide a holistic overview of creators’ online performances. Other helpful information includes the estimated rates creators charge for publishing sponsored content, which can help you find creators that meet your online campaign budget requirements.
Manage creators in groups
The CreatorDB platform’s group feature can help you easily categorize similar creators and find related ones. You can add similar creators to groups and sort them by language, number of followers, or follower growth rate. You can use the available data to compare the content performance of similar creators.
Competitor analysis
You can find out which creators your competitors have sponsored in the past and how frequently they have sponsored a creator’s content. The CreatorDB platform can show up to 40 recent sponsors. Understanding which brands a creator has worked with can help you avoid sponsoring the competitor-sponsored creators.
User interface
The CreatorDB user interface comprises three main navigation panels: the top navigation bar, the left navigation bar, and the side panel. The navigation bars provide shortcuts to the main CreatorDB features and settings.
| No. | Description |
|---|
| 1 | Top navigation bar |
| 2 | Left navigation bar |
| 3 | Side navigation panel |
Top navigation bar
By default, the system will load the Discover search page.
| No. | Label | Description |
|---|
| 1 | Discover | Search for creators using pre-defined filters in Discover search. |
| 2 | Keyword | Search for creators using pre-defined keywords. |
| 3 | Brand | Search for brands that have sponsored creators. |
| 4 | Content | Search for content or creators by uploaded content. |
| 5 | Search bar | Search for creators by entering their username or channel name. |
| 6 | CreatorDB plan | Shows your current CreatorDB plan tier. |
| 7 | Add creators | Add new creators to the CreatorDB database. |
| 8 | Account settings | Your user profile picture and shortcut to account settings. You can change your account settings or log out from the CreatorDB app. |
Left navigation bar
| No. | Label | Description |
|---|
| 1 | Discover search | Search for creators in the CreatorDB database by pre-defined filters, keywords, brands, or content. By default, the system will load the Discover search page. |
| 2 | Group | Manage creators in groups. |
| 3 | API | Links to the API dashboard. You can check your API credit usage status. |
| 4 | Brand scan | Scan creators’ previous sponsorship history to find out which brands creators are frequently working with. |
| 5 | Help center | Links to CreatorDB’s knowledge base, where you can look up answers to frequently asked questions and common app operations. |
| 6 | Browser extension | Links to the download page for the Chrome Extension, Creator Analytics by CreatorDB. For details, see Creator Analytics by CreatorDB User Guide. |
| 7 | Settings | Links to account settings, where you can change your username, reset passwords, language settings, or get your API key. |
Side navigation panel
| No. | Description |
|---|
| 1 | Hide or show side navigation panel |
| 2 | Add filter |
| No. | Label | Description |
|---|
| 1 | Saved filters | Manage saved search filters. You can add new filters, duplicate, rename, or delete filters. |
| 2 | Groups | Add or remove creators in groups as search conditions. |
| 3 | Sponsors | Add brand search criteria as search conditions. |
Account management
You can manage your account settings, such as editing your username and profile image, resetting your account password, changing your language settings, and more.
- Log in to CreatorDB.
- Click Settings.
The Account page appears.
Perform any of the following actions:
| Callout | Action | Steps |
|---|
| A | Edit username. | Click on the Name field and edit. |
| B | Update profile image. | a. Click Edit.
b. Select a file.
c. Click Open. |
| C | Reset password. | a. Click Send a reset email.
b. Follow the instructions in the email to reset your password. |
| D | Change language settings. | Select a language from the drop-down menu. |
| E | Opt in to CreatorDB updates. | Enable Keep me up to date with CreatorDB promotions and product releases. |
Searching the CreatorDB database
The CreatorDB database offers several search methods. You can search for creators using filters on the Discover search page search by keywords, content, or sponsors. CreatorDB recommends using limited filters to optimize your initial search and building up filters as you go. To narrow your search scope quickly, you can use advanced filters to find the most relevant creators. The advanced filters option is only available in Discover and Content search.
Searching for creators
You can search for creators by applying filter conditions on the Discover search page. You can search for creators on all supported platforms or by specific platforms, such as YouTube, Instagram, or TikTok.
- Log in to CreatorDB.
- Select All platforms.
- Select the filters as shown on the screen.
- Optional: Select Only show creators with emails.
-
Optional: Use advanced search.
- Click Advanced.
- Select filters.
-
Click Search.
Searching for creators on YouTube
- Log in to CreatorDB.
- Select YouTube.
- Select the filters as shown on the screen.
- Optional: Select Has sponsored content.
- Optional: Use advanced search.
- Click Advanced.
- Select filters.
- Click Search.
Searching for creators on Instagram
-
Log in to CreatorDB.
-
Select Instagram.
-
Select the filters as shown on the screen.
-
Optional:
- Select Only show verified Instagram accounts.
-
Optional: Use advanced search.
- Click Advanced.
- Select filters.
-
Click Search.
Searching for creators on TikTok
-
Log in to CreatorDB.
-
Select TikTok.
-
Select the filters as shown on the screen.
-
Optional: Select Only show verified TikTok accounts.
-
Optional: Use advanced search.
- Click Advanced.
- Select filters.
-
Click Search.
Managing filters
In the Discover search, you can save selected search conditions as a Filter that you can apply repeatedly to save search time. The filter include and exclude features allow you to create whitelists and blacklists. With the exclude feature, you can also list creators with whom you’ve already collaborated or declined to work.
Creating a filter
- Log in to CreatorDB.
By default, you will be on the Discover search page.
- Select a social media platform.
- Select filters and options.
- Click Save filters.
The Save selected filters window appears.
- Enter a filter name.
- Optional: Enter the filter description.
- Click Save.
Editing a filter
- Log in to CreatorDB.
- Expand the side navigation panel.
- Click Saved filters.
- Select a filter.
- Click on the kebab menu on the right.
- Perform any of the following:
| Callout | Action | Steps |
|---|
| 6a | Delete filter. | Click Delete. |
| 6b | Rename filter. | a. Click Rename.
b. Enter a new filter name.
c. Optional: Enter a filter description.
d. Click Save. |
| 6c | Duplicate filter. | Click Duplicate. |
Searching for creators by keywords
- Log in to CreatorDB.
- Click Keyword tab and enter a keyword.
- Optional: Select a keyword from the drop-down menu.
There are multiple ways to search for sponsoring brand information in the CreatorDB platform. This is one of the more common methods. For more details, see the following topics:
- Log in to CreatorDB.
- Click Brand.
- Enter keywords.
- Optional:
- Select brand filters.
- Select a social media platform.
- Select performance criteria filters.
- Click Search.
Searching for content
- Log in to CreatorDB.
- Click Content.
- Select a social media platform.
- Select content filters.
- Optional: Select Has sponsored content.
- Select creator filters.
- Optional: Use advanced search.
- Click Advanced.
More search filters appear.
- Select filters.
- Click Search.
Managing creators
You can add new creators to the CreatorDB database or view a creator’s profile and content performance. If there is a creator that you cannot find in our database, you can submit the creator’s platform ID to CreatorDB. Additionally, CreatorDB allows you to manage multiple creators through the Groups feature.
Adding creators to the database
You can add new creators to the database using any of the following methods:
Adding a creator to the database during a search
When you cannot find a creator through the search bar, you can submit this new creator to the CreatorDB database.
- Log in to CreatorDB.
- Enter a creator’s ID or name in the search bar.
- Click on a social media platform.
- Enter the creator’s ID or handle.
- Click Add creators.
The creator is added to the database.
Adding creators to the database by entering their account details
- Log in to CreatorDB.
- Click Add creators.
The Add new creators to CreatorDB window appears.
- Select a social media platform.
- Enter the required details in the Submission area.
- Click Submit.
Adding creators to the database by uploading a file
To upload multiple creators from a file, save the file in .csv format and follow the template format.
- Log in to CreatorDB.
- Click Add creators.
The Add new creators to CreatorDB window appears.
- Click Upload.
A window appears.
- Select a file.
- Click Open.
- Click Submit.
Viewing creator submission history
The Submission history shows the creator records you submitted to the CreatorDB database. It shows whether the creator was successfully submitted. Adding the creator’s data to the database can take one workday.
| No. | Label | Description |
|---|
| 1 | Updated | Shows the last date the system updated the submission history. |
| 2 | Update status | Refreshes the submission history to show the latest submitted creator record status. |
| 3 | Channel name | Shows the creator’s channel name, location, and whether the creator account is verified. |
| 4 | Platform submitted | Indicates the social media platform of the submitted creator’s account. |
| 5 | Channel ID/ Handle | The creator’s YouTube, Instagram, or TikTok ID or handle name. |
| 6 | Submitted time | Shows when you submitted the creator. |
| 7 | State | Shows the creator submission status. Submitted creators will undergo a review process before they are added to the database. Please see the following table for all submission states and descriptions. |
| Submission states | Description |
|---|
| Success | The creator has been submitted to the CreatorDB database and will undergo the review process. |
| Already exists | The submitted creator’s data is already available in the CreatorDB database. |
| Not available | The submitted creator’s format is invalid. Please check that the submitted creator’s ID follows the format in the on-screen instructions, or if the submitted file format is the same as the template file. |
| Process worker error | An error occurred while processing the submitted creators’ data. If you encounter this error, please contact CreatorDB at support@creatordb.app. |
| User not found | The system did not find the submitted creator’s data. |
| Private user | The submitted creator account is private. |
Key indicators and definitions
| No. | Label | Definition |
|---|
| 1 | Profile picture | The creator’s profile picture. |
| 2 | Creator name | The creator’s name or username. |
| 3 | Verification badge | Badge that indicates the creator has been verified by social media platforms, such as YouTube, Instagram, or TikTok. |
| 4 | Topics | The main topics of the creator’s content. |
| 5 | Add to group | Adds this creator to an existing group or a new group. |
| 6 | Location | The creator’s location. |
| 7 | Language | The creator’s spoken language. |
| 8 | YouTube subscribers | The creator’s total number of YouTube subscribers. |
| 9 | Instagram followers | The creator’s total number of Instagram followers. |
| 10 | TikTok followers | The creator’s total number of TikTok followers. |
| 11 | Total followers | The total number of followers is calculated by adding the creator’s followers on YouTube, Instagram, and TikTok. |
| 12 | Followers growth | The monthly follower growth rate of the creator’s main platform. A negative value indicates a decline. |
| 13 | CreatorDB score | An indicator that shows the creator’s overall performance on social media platforms based on the following six indicators: subscriptions, average views, engagement rate, subscription growth, average views growth, and engagement growth rate. The raw score is calculated by adding the six indicators and then finding the average compared to all other creators on social media platforms. The score range is on a scale from 0 to 100. |
| 14 | Engagement rate | The engagement rate of the creator’s main platform is displayed. The engagement rate is an indicator that shows how viewers interact with the content. |
| 15 | Recent sponsors | The latest brands to sponsor the creator’s content. |
| 16 | View emails | The creator’s email contact. |
| 17 | Channel ID | The creator’s YouTube channel or account ID. |
| 18 | Mentioned links | Links found in the creator’s profile. |
| 19 | Linktree links | The creator’s Linktree links. |
| 20 | Share profile | The link for sharing the creator’s profile with others. |
| 21 | Other social media accounts | The creator’s other social media accounts. For example, Mr. Beast also has a Facebook account. |
| 22 | Last updated | The most recent time the system updated the creator’s profile. |
| 23 | Personal description | The creator’s channel or account description. |
When buttons such as View emails, Mentioned links, or Linktree links are grayed-out, it indicates the specific creator data is unavailable.
Overview
The All platforms page on Overview lets you view the creator’s overall performance on major social media platforms, including YouTube, Instagram, and TikTok. It also allows you to view key performance indicators at a glance.
On the All platforms page, you can view a summary of the creator’s social media performance on multiple platforms. Note that this page only displays information from platforms where the creator has an account. In this example, we will look at a creator whose primary account is on YouTube. Aside from a few exceptions, all data is automatically collected from the relevant platform.
| No. | Metric | Definition |
|---|
| 1 | Main platform | A label that shows the creator’s primary social media platform. |
| 2 | Total YouTube subscribers | The total number of YouTube subscribers this creator’s channel has. |
| 3 | Active | A label that shows which social media platforms this creator has been actively posting content on over the last 30 days. |
| 4 | Monthly YouTube subscriber growth rate | This creator’s YouTube channel’s subscriber growth rate over the last 30 days. |
| 5 | Engagement rate (YouTube) | YouTube engagement rate is calculated as follows: Views(Likes + Comments) |
| 6 | Avg. views | The average number of views YouTube videos received over the past month. |
| 7 | Avg. likes | The average number of likes the creator’s videos received on YouTube. |
| 8 | Avg. comments | The average number of comments the creator’s videos received on YouTube. |
| 9 | Latest content (YouTube) | The latest date the creator uploaded content to YouTube. |
| 10 | Total Instagram followers | The total number of Instagram followers this creator’s account has. |
| 11 | Instagram follower growth rate | This creator’s Instagram account’s follower growth rate over the last 30 days. |
| 12 | Engagement rate (Instagram) | Instagram engagement rate is calculated as follows: Followers(Likes + Comments) |
| 13 | Avg. plays (Reels) | The average number of plays the creator’s Instagram reels received. |
| 14 | Average likes | The average number of likes for each Instagram post. |
| 15 | Average comments (Instagram) | The average number of comments for each Instagram post the creator posted. |
| 16 | Latest content (Instagram) | The latest date that the creator posted content onto Instagram. |
| 17 | Total TikTok followers | The total number of followers the creator’s TikTok account has. |
| 18 | TikTok follower growth rate | The creator’s TikTok account’s followers growth rate over the last 30 days. |
| 19 | Engagement rate (TikTok) | Used to measure followers’ interaction with content created by creators or influencers. TikTok engagement rate is calculated as follows: Plays(Hearts + Comments + Shares) |
| 20 | Avg. plays | The average number of plays the creator’s videos received on TikTok. |
| 21 | Average hearts | The average number of hearts received by the creator’s TikTok videos. |
| 22 | Average comments (TikTok) | The average number of comments received by the creator’s TikTok videos. |
| 23 | Latest content (TikTok) | The latest date the creator posted content onto TikTok. |
Creator overview
| No. | Metric | Definition |
|---|
| 1 | CreatorDB score | A unique score is calculated by adding subscriptions, average views, engagement rate, subscription growth, average views growth, and engagement growth rate and finding the median value. The score ranges from 0 to 100. |
| 2 | Follower rank by country | The creator’s followers’ national rankings compared to other creators from the same country in the CreatorDB database. |
| 3 | Follower rank by language | The creator’s followers rank by language compared to other creators from the same language in the CreatorDB database. |
| 4 | Global follower rank | The creator’s global rankings for total followers compared to other creators in the CreatorDB database. |
| Stars | Score range |
|---|
| 0 stars | 0 |
| 0.5 stars | 1 to 10 |
| 1 star | 11 to 20 |
| 1.5 stars | 21 to 30 |
| 2 stars | 31 to 40 |
| 2.5 stars | 41 to 50 |
| 3 stars | 51 to 60 |
| 3.5 stars | 61 to 70 |
| 4 stars | 71 to 80 |
| 4.5 stars | 81 to 90 |
| 5 stars | 91 to 100 |
| Ranking description | Score range |
|---|
| Poor | 0 to 25 |
| OK | 26 to 50 |
| Good | 51 to 65 |
| Great | 66 to 80 |
| Excellent | 81 to 90 |
| Superb | 91 to 100 |
Follower metrics
The follower metrics are updated daily and show a line graph over 90 days. On the All platform page, the line graph shows changes in follower growth on YouTube, Instagram, and TikTok. The Total follower growth indicators over 7 days, 30 days, and 90 days data are from the main platform where the creator is most active.
| No. | Metric | Definition |
|---|
| 1 | Last updated | The last date the system updated this creator’s total follower growth data. |
| 2 | Last 7 days growth | The total follower growth rate over the last 7 days (about 1 week). |
| 3 | Last 30 days growth | The total follower growth rate over the last 30 days (about 1 month). |
| 4 | Last 90 days growth | The total follower growth rate over the last 90 days (about 3 months). |
| 5 | Total followers | The number of followers changes over 90 days. |
| 6 | Follower growth | The creator’s total follower growth rate over one year. By default, CreatorDB shows the changes over 7 days, 30 days, and 90 days. The graph shows follower growth numbers on the creator’s YouTube, Instagram, and TikTok accounts. |
| No. | Metric | Definition |
|---|
| 1 | Last updated | The last date the system updated the monthly gain in followers data. |
| 2 | Monthly gain in total followers | Shows the gain in total followers for that month. |
| 3 | Followers | The change in number of followers gained per month. |
| 4 | Creator added in | The date the system added this creator to the CreatorDB database. |
| 5 | Months | The months over one year. |
Upload time (heat map)
The upload heat map indicates when a creator published the most recent 20 posts or videos. The heat map shows four periods throughout the day throughout the week that the creator uploads content and shows how frequently creators upload content. Note that the times are in the creator’s local time zone.
| Time period | Time range |
|---|
| Night | 0:00-6:00 |
| Morning | 6:01-12:00 |
| Afternoon | 12:01-18:00 |
| Evening | 18:01-24:00 |
Content breakdown
The content breakdown shows the most recent 20 posts by social media platforms over 3 months. You can view the content breakdown by content types or by platform.
| Platform types | Content types |
|---|
| YouTube | YouTube videos, YouTube shorts |
| Instagram | Instagram posts, Instagram reels |
| TikTok | TikTok posts |
Account quality
The account quality dashboard presents an overview of the global performance of the creator’s social media accounts. The indicators used to measure platform performance are based on the creator’s average performance compared to similar channels.
Brand dashboard
Shows the latest four brands that sponsored a channel. Detailed information includes the sponsored content publish date and the number of sponsored content. The dashboard can display up to 60 sponsors’ information.
Audience
This page will show the creator’s YouTube channel audience demographics, which are updated every 100 days. For details, see YouTube audience.
This page lists similar creator accounts in CreatorDB’s database. The related accounts feature can help you find creators in the same field for collaboration purposes or competitor analysis.
Content
Shows the latest content that the creator has posted on various platforms, content analytics, trending content tags, and content categories. It considers the videos’ historical average performance on multiple platforms, such as YouTube, Instagram, and TikTok.
When you click on a recent video, it will show an overview of the video’s performance on its respective platforms. For details, see the following articles:
Content analytics
On the Content page, you can view the creator’s recently posted content from all platforms and get details on the content analytics for content posted on all platforms. The content analytics metrics measure the content performance and posting frequency over 12 months. Each bar on the graph represents a month.
| No. | Label | Definition |
|---|
| 1 | Content per week | The total number of content posted weekly by the creator. |
| 2 | Content per month | The total number of content posted monthly by the creator. |
Brand
Select the Brand tab to view the creator’s video content sponsored by brands on YouTube and Instagram.
YouTube
On a creator profile page, you can view their YouTube channel performance by selecting the YouTube tab.
YouTube overview
By default, the creator profile page will show the Overview page of the selected platform. You can view a creator’s key YouTube performance statistics by going to a creator’s profile page and then select the YouTube tab.
| No. | Label | Definition |
|---|
| 1 | Main platform | Indicates the creator’s primary social media platform. |
| 2 | Subscribers | Total YouTube subscribers. |
| 3 | Active | An indicator that shows the creator has been actively uploading content to their YouTube channel over the last 30 days. |
| 4 | Subscriber growth rate | The YouTube channel’s subscriber growth rate over 30 days. |
| 5 | Percentile performance | The YouTube channel’s performance percentage compared to the median value of similar channels. |
| 6 | Latest content | The last date the creator uploaded content to YouTube. |
| No. | Label | Definition |
|---|
| 1 | Videos | Shows the key metrics performance for YouTube videos. |
| 2 | Shorts | Shows the key metrics performance for YouTube Shorts. |
| 3 | All | Shows the average key metrics performance from YouTube videos and shorts combined. |
| 4 | Active subscribers | Percentage of YouTube subscribers that are actively engaged over the past month. Active subscribers are calculated as: SubscribersAverage Video Views |
| 5 | Avg. views | The average number of views videos have received over the past month. (Unit by the millions. M = 1,000,000) |
| 6 | Engagement rate | The percentage of engagement rate. |
| 7 | Avg. likes/ comments | The average number of likes and comments the creator’s YouTube videos received over the past month. (Unit by the thousands. K = 1,000) |
| 8 | Last 30 days | The creator’s YouTube content view range over the last 30 days, excluding content posted in the past 3 days. Content here refers to YouTube videos and shorts. |
| 9 | Last 90 days | The creator’s YouTube videos or shorts view range over the last 90 days, excluding content posted in the past 3 days. |
| 10 | Minimum | The minimum number of views the creator’s uploaded content received. |
| 11 | Average | The average number of views the creator’s uploaded content received. |
| 12 | Maximum | The maximum number of views the creator’s uploaded content received. |
| No. | Label | Definition |
|---|
| 1 | CreatorDB score | The YouTube channel’s CreatorDB score. The unique score sums up the subscriber rankings, view rankings, engagement rankings, subscriber growth rates, video views growth rates, and the engagement growth rate and then finds the average. The calculations are in percentiles. |
| 2 | Rating | The CreatorDB score rating description. The ratings are superb (91 to 100), excellent (81 to 90), great (66 to 80), good (51 to 65), OK (26 to 50), and poor (0 to 25) |
| 3 | Subscriber rank by country | The subscriber rankings of the creator’s YouTube channel by country. |
| 4 | Subscriber rank by language | The subscriber rankings of the creator’s YouTube channel by language. |
| 5 | Global subscriber rank | The global subscriber rankings of the creator’s YouTube channel. |
| No. | Label | Definition |
|---|
| 1 | Monthly gain in total subscribers | The gain in total subscribers for that month. |
| 2 | Subscribers | The number of subscribers growth or decline in thousands (1k = 1,000 and 1M = 1,000,000). |
| 3 | Months | The time by months. |
| 4 | Total subscriber growth | The creator’s total number of subscriber growth over 12 months. |
| No. | Label | Definition |
|---|
| 1 | Day | The day the creator uploads content throughout the week. |
| 2 | Number of content | The number of YouTube videos and shorts uploaded. The darker the shade, the more videos uploaded. |
| 3 | Time | The time in the day that content is uploaded. |
| 4 | Summary | A summary of the creator’s main content upload time. |
| No. | Label | Definition |
|---|
| 1 | YouTube shorts | The percentage of YouTube shorts out of content posted to their channel. |
| 2 | YouTube videos | The percentage of YouTube video out of all content posted to their channel. |
| 3 | Summary | A summary of the creator’s content breakdown in percentages. |
YouTube interquartile range
You can view the creator’s account or channel’s video performance interquartile range on the respective YouTube, Instagram, and TikTok tabs. The interquartile range measures the spread of the middle half of the distribution. It contains the middle half of the dataset in the distribution of a quartile segment, split into four equal parts from low to high. This indicator can give you an overview of the creator’s content views, ranging from the lowest, median, to the highest number of views.
The interquartile range is calculated for the average of the most recent 20 YouTube videos to analyze the interquartile range.
| No. | Label | Definition |
|---|
| 1 | Minimum views | The minimum number of YouTube video views on this creator’s channel. |
| 2 | Median views | The average number of views YouTube videos have received on the creator’s channel. |
| 3 | Maximum views | The maximum number of views YouTube videos have received on the creator’s channel. |
| 4 | 25% quartile | The number of views the bottom 25% of videos have received on this creator’s YouTube channel. |
| 5 | Interquartile range (IQR) | The median number of views the middle-ranking videos have received on this creator’s YouTube channel. |
| 6 | 75% quartile | The number of views the top 25% of videos have received on this creator’s YouTube channel. |
YouTube audience
On the YouTube > Audience page, you can view a creator’s YouTube audience demographics.
| No. | Label | Description |
|---|
| 1 | Audience top region | The primary region that the creator’s audience is from. |
| 2 | Audience gender | The prominent audience gender. |
| 3 | Audience age | The primary age group of the creator’s YouTube channel. Shows the percentage of audiences from this age group. |
| 4 | Average age | The audience’s average age. |
| 5 | Audience regions | The top five regions where the creator’s audience is from. |
| 6 | Country breakdown | The countries where most of the audience is from are generated by CreatorDB’s proprietary AI model. |
| No. | Label | Description |
|---|
| 1 | Male | The proportion of male audience for this creator’s channel. |
| 2 | Female | The proportion of female audience for this creator’s channel. |
| 3 | Proportion (%) | The percentage of the audience by different age brackets for this creator’s channel. |
| 4 | Age range | The audience age range for this creator’s channel. |
YouTube content
On the Youtube > Content page, you can view the most recent YouTube videos uploaded to the creator’s channel on the content page. You can also scroll down the page to view the creator’s historical YouTube video performance and content analytics.
The video views in the example screenshot are for reference only and do not reflect the actual video’s performance.
| No. | Label | Definition |
|---|
| 1 | Views | Total number of views this YouTube video received. (Note that 1K represents 1,000 views.) |
| 2 | Likes | The total number of likes this YouTube video received. |
| 3 | Engagement Rate | The engagement rate of this YouTube video. This is calculated as follows: Views(Likes + Comments) |
| 4 | Comments | The total number of comments this YouTube video received. |
| 5 | Video Length | The length of this YouTube video in minutes. |
| 6 | Followers | The creator’s total number of YouTube subscribers. |
| 7 | 1 Day Views | The number of views this YouTube video received on the first day it was published. |
| 8 | 7 Day Views | The number of views the YouTube video received on the seventh day it was published. |
| 9 | 30 Day Views | The number of views the YouTube video received on the thirtieth day it was published. |
| 10 | Add to group | Add this creator to an existing group. |
| 11 | Published date | When the creator published the YouTube video. |
| 12 | Sponsored badge | A label that indicates if a brand or company has sponsored this YouTube video. |
| 13 | Sponsors | The sponsors of this YouTube video. |
| 14 | Content Quality | The quality indicators of this YouTube video are displayed in percentages. |
| 15 | Performance Metrics | The views performance of this YouTube video over time. |
| No. | Metric label | Definition |
|---|
| 1 | Views gauge | An indicator that shows this YouTube video’s overall views performance and ranking. |
| 2 | Views score | The YouTube video’s views score out of 100. The higher the score, the better the performance. |
| 3 | Views performance | The YouTube video’s average views performance compared to the median value of the creator’s latest 20 YouTube posts in percentage. |
| 4 | Likes gauge | An indicator that shows this YouTube video’s overall likes performance and ranking. |
| 5 | Likes score | The YouTube video’s likes score out of 100. The higher the score, the better the performance. |
| 6 | Likes performance | The YouTube video’s average likes performance compared to the median value of the creator’s latest 20 YouTube posts in percentage. |
| 7 | Engagement rate gauge | An indicator that shows this YouTube video’s overall engagement rate performance and ranking. For details, see Platform statistics. |
| 8 | Engagement rate score | The YouTube video’s engagement rate score is out of 100. The higher the score, the better the performance. |
| 9 | Engagement rate performance | The YouTube video’s engagement rate performance compared to the median value of the creator’s latest 20 posts on YouTube. |
| No. | Metric label | Definition |
|---|
| 1 | Views | The number of views this YouTube video received. |
| 2 | Date | The dates over 90 days. |
| No. | Label | Description |
|---|
| 1 | Avg. views | The average number of views this creator’s YouTube videos receive. |
| 2 | Avg. likes | The average number of likes this creator’s YouTube videos receive. |
| 3 | Avg. engagement rate | The average number engagement rate of this creator’s YouTube videos. |
| 4 | Drop-down menu | View the creator’s performance by average views, average likes, average comments, average engagement rate, or average video length over one year. The YouTube video engagement rate is Views(Likes+ Comments) |
| 5 | Metrics | The selected YouTube video performance metric. The Y-axis of this line graph will display the relevant selected metric, such as views, likes, comments, video length or engagement rates. |
| 6 | Dates | The dates in 5-day intervals over one year. |
| No. | Label | Description |
|---|
| 1 | Category breakdown | The percentage of YouTube content posted by this creator by categories. |
| 2 | Content per week | The number of content this creator posts to their YouTube channel weekly. |
| 3 | Content per month | The number of content this creator posts to their YouTube channel monthly. |
| 4 | Average content | The average number of content that this creator posts per month. |
| 5 | Content | The number of published YouTube content. |
| 6 | Time | The period by months over one year. |
YouTube brand
On the YouTube > Brand page, you can view the creator’s sponsored YouTube videos over one year. You can view detailed sponsored content performance, sponsoring brand industries, and recently sponsored content.
| No. | Label | Description |
|---|
| 1 | Sponsored videos | The total number of sponsored videos on this creator’s YouTube channel over one year. |
| 2 | Sponsored (percentage) | The percentage of sponsored videos out of total videos uploaded by the creator to their YouTube channel over one year. |
| 3 | Total videos | The total number of videos uploaded to this creator’s YouTube channel over one year. |
| 4 | Engagement rate (Sponsored content) | The average engagement rate of the creator’s sponsored YouTube content. |
| 5 | Avg. views (Sponsored content) | The average views the creator’s sponsored YouTube videos received. |
| 6 | Avg. likes (Sponsored content) | The average likes the creator’s sponsored YouTube videos received. |
| 7 | Avg. comments (Sponsored content) | The average comments the creator’s sponsored YouTube videos received. |
| 8 | Latest sponsored content (Sponsored content) | The date of the creator’s last uploaded sponsored YouTube video. |
| 9 | Engagement rate (Total content) | The average engagement rate of all the creator’s YouTube videos over one year. |
| 10 | Avg. views (Total content) | The average views of all the creator’s YouTube videos over one year. |
| 11 | Avg. likes (Total content) | The average likes of all the creator’s YouTube videos over one year. |
| 12 | Avg. comments (Total content) | The average comments of all the creator’s YouTube videos over one year. |
| 13 | Latest content | The date of the creator’s last updated video. |
| 14 | Industries | Lists the industry of all sponsored videos. You can sort sponsored videos by industries by clicking on an industry. |
| 15 | Drop-down menu | Sort the sponsoring brands by Most recent or Total sponsored content. |
| 16 | Brands | You can view the sponsoring brand’s basic information including their total sponsored content, latest sponsored content, and more. You can sort sponsored videos by the sponsoring brand by selecting a brand. For details, see Viewing a brand profile. |
| No. | Label | Description |
|---|
| 1 | Most recent | Sorts the sponsored videos from latest to oldest. |
| 2 | Views | Sorts sponsored videos by number of views received in descending order. |
| 3 | Likes | Sorts sponsored videos by number of likes received in descending order. |
| 4 | Engagement rate | Sorts sponsored videos by engagement rate in descending order. The engagement rate for YouTube videos is calculated as follows: Views(Likes+ Comments) |
Instagram
On a creator profile page, you can view their Instagram account performance by selecting the Instagram tab.
Instagram overview
| No. | Label | Definition |
|---|
| 1 | Total number of followers | The total number of Instagram followers the creator has. (k= 1,000, M= 1,000,000) |
| 2 | Active | An indicator that shows the creator has been actively uploading content to their Instagram account over the last 30 days. |
| 3 | Follower growth rate | The creator’s Instagram follower growth rate over 30 days. |
| 4 | Performance percentage | The creator’s Instagram followers growth compared to the median value of similar channels. |
| 5 | Latest content | The last date the creator uploaded content onto Instagram. |
The Views range feature currently only supports Instagram reels.
| No. | Label | Definition |
|---|
| 1 | Posts | Shows the key metrics performance for Instagram posts. |
| 2 | Reels | Shows the performance of the key metrics for Instagram reels. |
| 3 | All | Shows the performance of the key metrics for combined Instagram posts and reels. |
| 4 | Recent reels | The latest reels the creator has uploaded to Instagram. |
| 5 | Engagement rate | Measures how followers interact with the creator’s content on Instagram. The engagement rate on Instagram is: FollowersLikes+Comments |
| 6 | Avg. plays | The average number of times the Instagram reel was viewed. (Unit by the millions. M =1,000,000) |
| 7 | Avg. likes | The average number of likes the creator’s Instagram reels receive. (Unit by the thousands. k = 1,000) |
| 8 | Avg. comments | The average number of comments the creator’s Instagram reels received. |
| 9 | Last 30 days | The number of plays the creator’s Instagram reels received over the last 30 days, excluding reels published in the last 3 days. |
| 10 | Last 90 days | The number of plays the creator’s Instagram reels received over the last 90 days, excluding reels published in the last 3 days. |
| 11 | Minimum | The minimum number of plays the creator’s Instagram reels received. |
| 12 | Average | The average number of plays the creator’s Instagram reels received. |
| 13 | Maximum | The maximum number of plays the creator’s Instagram reels received. |
| No. | Label | Definition |
|---|
| 1 | CreatorDB score | The Instagram account’s CreatorDB score. The unique score sums up the followers’ rankings, view rankings, engagement rankings, followers’ growth rates, post views growth rates, and the engagement growth rate, and then the average is calculated. The calculations are in percentiles. |
| 2 | Account rating | The CreatorDB score rating description. The ratings are superb (91 to 100), excellent (81 to 90), great (66 to 80), good (51 to 65), OK (26 to 50), and poor (0 to 25). |
| 3 | Follower rank by country | The follower rankings of the creator’s Instagram account by country. |
| 4 | Follower rank by language | The follower rankings of the creator’s Instagram account by language. |
| 5 | Recent posts & reels | The latest posts and reels the creator has uploaded to Instagram. |
| 6 | Global follower rank | The global follower rankings of the creator’s Instagram account. |
| No. | Label | Definition |
|---|
| 1 | Followers growth per month | The number of followers gained for this Instagram account for that month. |
| 2 | Followers | The number of followers. |
| 3 | Period | The months in a year. |
| 4 | Summary | A summary of the total number of Instagram followers the creator gained over one year. A negative number indicates the creator lost that amount of followers over a year. |
| No. | Label | Definition |
|---|
| 1 | Day | The days throughout the week. |
| 2 | Uploads | The number of Instagram content uploaded on this day and time. |
| 3 | Time | The times this creator published Instagram content throughout the day. |
| No. | Label | Definition |
|---|
| 1 | Instagram reels | The percentage of Instagram reels uploaded to the creator’s account over 3 months. |
| 2 | Instagram posts | The percentage of Instagram posts uploaded to the creator’s account of the most recent 20 posts within three months. |
| No. | Label | Definition |
|---|
| 1 | Minimum likes | The minimum number of likes this creator’s Instagram account has received. |
| 2 | Median likes | The average number of likes this creator’s Instagram account has received. |
| 3 | Maximum likes | The maximum number of likes this creator’s Instagram account has received. |
| 4 | 25% quartile | The number of likes the bottom 25% of posts have received on this creator’s Instagram account. |
| 5 | Interquartile range (IQR) | The median number of likes the middle-ranking Instagram posts have received on the creator’s account. |
| 6 | 75% quartile | The number of likes the top 25% of posts have received on this creator’s Instagram account. |
Instagram content
This page displays the latest content uploaded to Instagram and content analytics, such as average likes, comments, and engagement rates.
| No. | Label | Definition |
|---|
| 1 | View profile | The creator’s Instagram profile page. |
| 2 | Likes | The total likes an Instagram post receives. |
| 3 | Comments | The total comments the Instagram post received. |
| 4 | Engagement | The Instagram post’s engagement rate is calculated as follows: Followers(Likes + Comments) |
| 5 | Avg. Engagement | The average engagement rate for the last 20 Instagram posts. |
| 6 | Video Length | The length of this Instagram post or reel in minutes. |
| 7 | Followers | The creator’s number of followers on Instagram. |
| 8 | 1 Day Likes | The total number of likes this Instagram post received when the creator posted it. |
| 9 | 7 Day Likes | The total number of likes this Instagram post received 7 days after the creator posted it. |
| 10 | 30 Day Likes | The total number of likes the Instagram post received 30 days after the creator posted it. |
| 11 | Add to group | Add this Instagram creator to a group. |
| 12 | Publish date | The date this post was published on Instagram. |
| 13 | Content Quality | This Instagram post’s quality is based on likes and engagement rates. |
| 14 | Performance Metrics | This Instagram post’s performance based on the number of likes received over 30 days. |
| No. | Metric Label | Definition |
|---|
| 1 | Likes rating | A gauge that shows this Instagram post’s likes performance and descriptive rating. |
| 2 | Likes score | This Instagram post’s likes score out of 100. |
| 3 | Comparison to median likes | This shows Instagram’s post likes performance in percentage compared to the median number of likes recent posts received. |
| 4 | Engagement rating | A gauge that shows this Instagram post’s engagement rate performance and descriptive rating. |
| 5 | Engagement rate score | This Instagram post’s engagement rate is out of a total score of 100. |
| 6 | Comparison to median engagement rate | This shows Instagram’s post engagement rate performance in percentage compared to the median engagement rate of recent posts. |
| No. | Label | Description |
|---|
| 1 | Likes | The number of likes the creator’s Instagram posts received. |
| 2 | Date | The dates over 30 days. |
| No. | Label | Description |
|---|
| 1 | Avg. likes | The average number of likes this creator’s Instagram posts receive. |
| 2 | Avg. comments | The average number of comments this creator’s Instagram posts receive. |
| 3 | Avg. engagement rate | The average number engagement rate of this creator’s Instagram posts. |
| 4 | Drop-down menu | View the creator’s performance by average likes, average comments, and average engagement rate over one year. The Instagram post engagement rate is Views(Likes + Comments). |
| 5 | Metrics | The selected Instagram metric. The Y-axis of this line graph will display the relevant selected metric view, such as likes, comments, and engagement rates. |
| 6 | Dates | The dates in 5-day intervals over one year. |
| No. | Label | Description |
|---|
| 1 | Category breakdown | A verified Instagram business account’s category. |
| 2 | Content per week | The number of Instagram posts published by this creator weekly. |
| 3 | Content per month | The number of Instagram posts this creator published monthly. |
| 4 | Pieces of content | The number of Instagram posts this creator published for that particular month. |
| 6 | Content | The number of Instagram posts and reels posted by this creator. |
| 7 | Date | The months over one year. |
Instagram brand
You can view a creator’s sponsored Instagram videos at a glance on the CreatorDB platform. The dashboard displays the total number of Instagram videos that brands have sponsored, the date of the brand’s last sponsored video, and the brand’s industry.
TikTok
On a creator profile page, you can view their TikTok account performance by selecting the TikTok tab.
TikTok overview
| No. | Label | Definition |
|---|
| 1 | Total number of followers | The total number of TikTok followers this creator has by the thousands. (k= 1,000, M= 1,000,000) |
| 2 | Active | An indicator that shows the creator has been actively uploading content to their TikTok account over the last 30 days. |
| 3 | Follower growth rate | This creator’s TikTok follower growth rate over 30 days. |
| 4 | Performance percentage | This creator’s TikTok followers growth compared to the median value of similar TikTok accounts. |
| 5 | Latest content | The last date the creator uploaded content onto TikTok. |
| No. | Label | Definition |
|---|
| 1 | Average plays | The average number of plays the creator’s TikTok posts receive. (Units by the thousands. k = 1,000) |
| 2 | Average hearts | The average number of hearts the creator’s TikTok posts receive. |
| 3 | Average comments | The average number of comments the creator’s TikTok posts receive. |
| 4 | Engagement rate | The engagement rate of the creator’s TikTok posts is calculated by Plays(Hearts + Comments + Shares). |
| 5 | Last 30 days | The number of plays the creator’s TikTok posts received over 30 days, excluding posts published in the last 3 days. |
| 6 | Last 90 days | The number of plays the creator’s TikTok posts received over 90 days, excluding posts published in the last 3 days. |
| 7 | Minimum | The minimum number of plays the creator’s TikTok’s posts received. |
| 8 | Average | The average number of plays the creator’s TikTok’s posts received. |
| 9 | Maximum | The maximum number of plays the creator’s TikTok’s posts received. |
| No. | Label | Definition |
|---|
| 1 | TikTok platform score | The creator’s percentile ranking on TikTok. This unique value is calculated using the following metrics: Number of followers, followers growth, engagement rate, engagement growth rate, average plate, and average growth rate. |
| 2 | Account rating | The CreatorDB score rating description. The ratings are superb (91 to 100), excellent (81 to 90), great (66 to 80), good (51 to 65), OK (26 to 50), and poor (0 to 25) |
| 3 | Follower rank by country | The follower rankings of the creator’s TikTok account by country. |
| 4 | Follower rank by language | The follower rankings of the creator’s TikTok account by language. |
| 5 | Global follower rank | The global follower rankings of the creator’s TikTok account. |
| No. | Label | Definition |
|---|
| 1 | Followers growth per month | The number of followers gained for this TikTok account for that month. |
| 2 | Followers | The number of followers. |
| 3 | Period | The months in a year. |
| 4 | Summary | A summary of the change in the total number of followers of this creator’s TikTok account over 12 months. |
| No. | Label | Definition |
|---|
| 1 | Day | The days throughout the week. |
| 2 | Uploads | The number of TikTok videos uploaded on this day and time. |
| 3 | Time | The times this creator published TikTok videos throughout the day. |
| No. | Label | Definition |
|---|
| 1 | Minimum plays | The minimum number of plays this creator’s TikTok videos have received. |
| 2 | Median plays | The average number of plays this creator’s TikTok videos have received. |
| 3 | Maximum plays | The maximum number of plays this creator’s TikTok video has received. |
| 4 | 25% quartile | The number of plays the bottom 25% of videos have received on this creator’s TikTok account. |
| 5 | Interquartile range (IQR) | The median number of plays the middle-ranking videos have received on this creator’s TikTok account. |
| 6 | 75% quartile | The number of plays the top 25% of videos have received on this creator’s TikTok account. |
TikTok content
You can view changes in TikTok’s historical average plays (views), average hearts, average comments, and average engagement rate. You can also view the creator’s content analytics to understand content production consistency better.
| No. | Label | Definition |
|---|
| 1 | Plays | The number of plays this TikTok video received. |
| 2 | Hearts | The number of hearts this TikTok video received. |
| 3 | Engagement | The engagement rate of this TikTok video. For TikTok videos, the engagement rate is: Plays(Hearts + Comments + Shares). |
| 4 | Comments | The number of comments this TikTok video received. |
| 5 | Video length | The length of this TikTok video. |
| 6 | Followers | The total followers this creator’s TikTok account has. |
| 7 | 1 Day Plays | This TikTok video’s total number of plays received when the creator posted it. |
| 8 | 7 Day Plays | This TikTok video’s total number of plays received 7 days after the creator posted it. |
| 9 | 30 Day Plays | This TikTok video’s total number of plays received 30 days after the creator posted it. |
| 10 | Add to group | Add this TikTok creator to a group. |
| 11 | Date | The date this TikTok video was posted by the creator. |
| 12 | Content quality | This TikTok video’s quality is based on respectively the number of plays and hearts it received and its engagement rate. |
| 13 | Performance metrics | The performance of this TikTok video is based on the number of plays it received over 30 days. |
| No. | Label | Definition |
|---|
| 1 | Plays rating | A gauge that shows this TikTok video’s plays performance and descriptive rating. |
| 2 | Plays score | This TikTok video’s plays score out of 100 points. |
| 3 | Comparison to median plays | This shows TikTok video’s play performance in percentage compared to the median number of plays this creator’s last 20 TikTok videos received. |
| 4 | Hearts rating | A gauge that shows this TikTok video’s heart performance and descriptive rating. |
| 5 | Hearts score | This TikTok video’s hearts score out of a total of 100 points. |
| 6 | Comparison to median hearts | This shows TikTok video’s hearts performance in percentage compared to median number of hearts this creator’s last 20 TikTok videos received. |
| 7 | Engagement rating | A gauge that shows this TikTok video’s engagement rate performance and descriptive rating. |
| 8 | Engagement rate score | This TikTok video’s engagement rate score out of 100 points. |
| 9 | Comparison to median engagement rate | This shows the TikTok video’s engagement rate performance in percentage compared to the median engagement rate of this creator’s last 20 TikTok videos. |
| No. | Label | Definition |
|---|
| 1 | Plays | The number of plays this TikTok video received. |
| 2 | Date | The dates over 90 days. |
| No. | Label | Definition |
|---|
| 1 | Average plays | The average number of plays this creator’s TikTok videos have received. |
| 2 | Average hearts | The average number of hearts this creator’s TikTok videos have received. |
| 3 | Average engagement rate | The average engagement rate of this creator’s TikTok videos. |
| 4 | Drop-down menu | A drop-down menu allows you to view the TikTok content history by average comments, average plays, average hearts, and engagement rates. |
| 5 | Metrics | The selected TikTok video metric. The Y-axis of this line graph will display the relevant selected metric view, such as plays, hearts, and engagement rates. |
| 6 | Dates | The dates over 90 days. |
| No. | Label | Definition |
|---|
| 1 | Content per week | The number of TikTok videos this creator posted weekly. |
| 2 | Content per month | The number of TikTok videos this creator posted monthly. |
| 3 | Average pieces of content | The average pieces of TikTok content this creator posted over one year. |
| 4 | Content | The number of TikTok videos posted by this creator. |
| 5 | Time | The months over one year. |
Downloading creator profiles
You can download up to 1,500 creator profiles on the same page each time.
- The system will download all creator profiles on the same page.
- The system currently does not support downloading selected creators. To download only selected creators, add them to a group and download the group. For details, see Downloading creators in a group.
- You can cancel the download anytime by clicking Cancel.
-
Log in to CreatorDB.
-
Search for creators.
For details, see Searching for creators.
-
Click Download.
Downloading all creator profiles on the same page may take a few minutes.
Managing groups
You can manage groups of creators to see how similar creators perform, view the brands that sponsor them, or download their data.
Creating a group
- Log in to CreatorDB.
- Click Group.
- Click + Create new group.
- Enter a Group name.
- Optional: Enter a group description.
- Click Save.
Adding a creator to a group through a creator profile
- Log in to CreatorDB.
- Enter the creator ID or name in the search bar.
- Click on the creator.
- Click Add to group.
- Select a group.
- Click Save.
Adding creators to a group through the search results table
- Log in to CreatorDB.
- Search for creators.
For details, see Searching for creators.
- Select creators.
- Click Add to…
A window appears.
- Click Add to group.
- Select a group.
- Click Save.
Importing creators to groups by entering creator IDs
- Log in to CreatorDB.
- Click Group.
- Select a group.
- Click + Import creators.
A window appears.
- Select a social media platform.
- Enter the information as shown on the screen.
- Click Submit.
Importing creators to groups by uploading a file
The uploaded file must follow the format shown in the template.
- Log in to CreatorDB.
- Click Group.
- Select a group.
- Click + Import creators.
A window appears.
- Click Upload.
A window appears.
- Select a file.
- Click Open.
The file is uploaded.
- Click Submit.
Copying creators in a group
Copying creators in a group will make duplicate copies of the selected creators. The copied creators will appear in both the original and new groups.
- Log in to CreatorDB.
- Click Group.
- Select a group.
-
Select creators.
-
Click Copy to.
-
Click Copy to group.
-
Select a group.
-
Click Save.
Moving creators to another group
Moving creators in a group will move the selected creators from the original group to the newly selected group.
-
Log in to CreatorDB.
-
Click Group.
-
Select a group.
-
Select creators.
-
Click Move to.
-
Click Move to group.
-
Select a group.
-
Click Save.
Editing a group
-
Log in to CreatorDB.
-
Click Group.
-
Select a group and click the edit icon.
A window appears.
-
Edit the group name or description.
-
Click Save.
Deleting a group
-
Log in to CreatorDB.
-
Click Group.
-
Select a group and click the delete icon.
A confirmation window appears.
-
Click Delete.
Downloading creators in a group
The downloaded creator’s profile data will be in .csv format.
-
Log in to CreatorDB.
-
Click Group.
-
Select a group.
-
Click Download.
The data of all creators in the group will be downloaded.
You can find a YouTube creator’s past brand collaborations through the Brand Scan feature, which can help you gain insight into competitors’ online marketing activities over the past year. With this feature, you can filter out creators who might be working with competitors and avoid conflicts of interest. The brand scan feature displays a creator’s latest sponsorship deals over the past year and allows you to group creators and download their brand scan results.
- This feature currently only supports YouTube.
- To avoid failed uploads, make sure your file follows the template’s .csv file format.
-
Log in to CreatorDB.
-
Click Brand Scan.
-
Click Scan by importing creators.
The Import creators to start scan page appears.
-
Click Upload.
-
Select a .csv file to upload.
-
Click Select brands.
-
Enter brand names or select brands from the Suggested brands list.
-
Optional: Save brands.
-
Click Save.
The Save brands for scanning window appears.
-
Enter a name.
-
Click Save.
The brand appears in the Saved brands column.
In the future, you can click on the saved brands button to quickly scan for sponsorships.
-
Click Start scan→.
- Based on the number of brands and creators scanned, the brand scan process may take a few minutes.
- By default, the page will show creators with no sponsorship history. Click the Sponsorships found tab to check creators with brand deals.
-
Optional: Create a new group from scan results.
- Click on the No sponsorship history or Sponsorships found tab.
- Select a creator or click Select all.
- Click Add to new group.
The creator is added to the list on the right.
To add multiple creators, select the Select all option or select multiple creators and click +Add to new list.
-
Select a creator.
-
Click + Create new group.
The Create new group page appears.
-
Enter a group name.
-
Optional: Enter a group description.
-
Click Save.
The new group is created.
-
Optional: Click Download CSV.
Downloads the groups’ data.
-
Click End Scan.
A confirmation message appears.
-
Click Scan ended.
To scan for sponsorships by a group, you must create a group. For details, see Creating a group.
-
Log in to CreatorDB.
-
Click Brand scan.
-
Click Scan by group.
-
Select a group.
-
Click Select brands.
The Select brands to scan panel appears.
-
Enter the brand name or select brands from the recommended list.
-
Optional: Save brands.
-
Click Save.
The Save brands for scanning window appears.
-
Enter a name.
-
Click Save.
The brand appears in the Saved brands column.
In the future, you can click on saved brands button to quickly scan for sponsorships.
-
Click Start scan.
The brand scan results are displayed.
-
Optional: Create a new group from the scan results.
- Click on the No sponsorship history or Sponsorships found tab.
- Select creators or click Select all.
- Click +Add to new group.
The creator is added to the list on the right.
To add multiple creators, select the Select all option or select multiple creators and click +Add to new list.
-
Select the creator or Select all.
-
Click + Create new group.
The Create new group page appears.
-
Enter a group name.
-
Optional: Enter a group description.
-
Click Save.
The new group is created.
-
Optional: Click Download CSV.
Downloads the groups’ data.
It may take a few minutes to download the creator data.
-
Click End Scan.
A confirmation message appears.
-
Click Scan ended.
Viewing brand scan results
| No. | Label | Description |
|---|
| 1 | Total creators | The number of creators scanned for brand sponsorship deals over one year. |
| 2 | No sponsorship history | The number of creators scanned that do not have any sponsorship deals with the selected brands over the past year. |
| 3 | Sponsorships found | The number of creators scanned that have sponsored deals with the specified brands. |
| 4 | Content scanned | The number of videos scanned by the system. |
| 5 | Search creators… | Search bar for finding specific creators. |
| 6 | Sponsorships found | Tab that allows you to switch view from creators with no sponsorship history to those with sponsorships. |
| 7 | Video posted date | Allows you to filter sponsored creators by their videos posted within 2 months, 6 months, or up to 1 year. |
| 8 | Creator username | The creator’s account or channel name on the specified social media platform. |
| 9 | Creator profile link | The link to the creator’s profile page on the CreatorDB app. For details, see Viewing a creator’s profile and performance. |
| 10 | Videos scanned | The total number of creator videos scanned. |
| 11 | Sponsorships found | The sponsoring brand’s name. |
| 12 | Number of mentions | The number of times the sponsoring brand is mentioned in the video. |
| 13 | Video title | The sponsored video title. |
| 14 | Views | The number of views the sponsored video received. |
| 15 | Video publish date | The date that the sponsored video was published on the social media platform. |
| 16 | Video link | The link to the video on the social media platform. |
| 17 | Last mention | The last time the sponsoring brand was mentioned by the creator in a sponsored video. |
Managing brands
You can search for brands that have collaborated and sponsored creators. Find out which creators and platforms competing brands are sponsoring and their sponsored content performance using the CreatorDB platform. Aside from conducting competitor analysis, the Brand page also allows you to gain insight into creators sponsored content performance.
Searching for brands by keywords
- Log in to CreatorDB.
- Go to Search→ Brand.
- Enter a keyword.
- Click Search.
Searching for brands by filters
- Log in to CreatorDB.
- Go to Search→ Brand.
- Select brand filters.
- Optional: Select a sponsored platform.
- Optional: Select the sponsored platform filters.
- Click Search.
Viewing a brand’s profile
- Log in to CreatorDB.
- Go to Search→ Brand.
- Go to Search results and select a brand.
You can view the following information:
| No. | Label | Description |
|---|
| 1 | Brand logo | The brand’s logo. |
| 2 | Brand name | The brand’s name. |
| 3 | Industries | The industries that the brand operates in. |
| 4 | Domain | The web domain of the brand’s official website. |
| 5 | Country | The country of the brand. |
| 6 | Language | The language of the brand. |
| 7 | Total Views | The total views the brand’s sponsored content received. |
| 8 | Total Sponsorships | The total number of sponsorships the brand has sponsored. |
| 9 | Engagement Rate | The average engagement rate of the brand’s sponsored content. |
| 10 | Avg. Views | The average number of views the brand’s sponsored content received. |
| 11 | Avg. Likes | The average number of likes the brand’s sponsored content received. |
| 12 | Avg. Comments | The average number of comments the brand’s sponsored content received. |
| 13 | Mentioned links | The brand’s mentioned links. |
| 14 | Social media accounts | The brand’s social media accounts. |
| 15 | Competitors | The brand’s top competitors. |
| 16 | Brand description | The brand’s description. |
Viewing brand overview statistics
| No. | Label | Description |
|---|
| 1 | Avg. views | View the changes in the average number of views the brand’s sponsored content received over a year. |
| 2 | Avg. likes | View the changes in the average number of likes the brand’s sponsored content received over a year. |
| 3 | Avg. engagement rate | View the changes in the average engagement rate of the brand’s sponsored content over a year. |
| 4 | Drop-down menu | Select a metric from the drop-down menu to view the brand’s sponsored content’s historical performance over the specified period. Supported metrics include average views, average likes, average comments, and average engagement rate. |
| 5 | Period range | Click on a tab to specify the period of sponsored content’s historical performance that you would like to view. You can view a selected metric’s performance over 7 days, 30 days, and 90 days performance. |
| 6 | Metric | Shows the selected brand sponsored content performance metric, for example the number of views, likes, comments, or engagement rates. |
| 7 | Date | The date. |
| No. | Label | Description |
|---|
| 1 | Sort | The brand’s logo. |
| 2 | Edit columns | You can select which columns to show in the table. |
| 3 | Download | Download the list of creators that have been sponsored by the brand. Note that only results on one page are downloaded at a time. |
| 4 | Table list | By default, the sponsored creator results are displayed in the table list view. In the table list view, you can show or hide information in certain columns. |
| 5 | Horizontal card | The horizontal card view displays the sponsored creators information in a card format. It shows key creator performance metrics, such as follower growth, engagement rate, CreatorDB total score, and Avg. views. It also will show the creator’s latest two videos that were sponsored by the brand. You cannot modify the displayed creator information in this view mode. |
| 6 | Name | The sponsored creator’s name. |
| 7 | Country | The sponsored creator’s country of origin. |
| 8 | Social platform | The social media platforms that the sponsored creator is active on. |
| 9 | Language | The sponsored creator’s primary language. |
| 10 | Followers (Main platform) | The sponsored creator’s number of followers on the social media platform that they are most active on. |
| 11 | Follower growth (Main platform) | The sponsored creator’s follower growth rate on their main social media platform over one year. |
| 12 | Topics | The main content topics of the sponsored creator. |
Managing API credits
API credits are required to integrate CreatorDB data with your application or download the database data for further analysis. Based on your CreatorDB subscription plan, you will get a specific number of free API credits that renew each month. You can purchase additional API credits when you exceed your free API credit quota by contacting CreatorDB. Purchased API credits expire upon usage and can be carried over to the next billing cycle. You can view the following API credit usage data by going to API > API dashboard.
| No. | Label | Description |
|---|
| 1 | By credits used | Shows API credit usage data by the number of credits used to make calls to the CreatorDB API server. |
| 2 | By requests made | Shows API credit usage data by the number of API requests made to the CreatorDB API server. |
| 3 | Period | Select a tab to specify the period of API data usage. You can view the data by 7 days, 30 days, or 90 days. |
| 4 | Metrics | Displays the specified API usage metrics, for example the API credits used or number of requests made. |
| 5 | Date | Shows up to a maximum of 90 days. |
| 6 | Endpoint | The CreatorDB API that you have called. The API credits used for the call are shown in parentheses “()”. |
| 7 | API credits used | The number of API credits used to call the CreatorDB API. |
| 8 | Total usage | Shows the percentage of API credits an API endpoint uses. |
| 9 | Subscription credits | The API credits included in your CreatorDB plan. Any unused subscription API credits expire at the end of the month, and this API credit quota renews every month. |
| 10 | Purchased credits | Any extra API credits you have purchased on top of your API subscription credits. Purchased API credits expire upon usage. |
| 11 | Current usage | Shows the API credits you have used. |
| 12 | Remaining quota | Shows the remaining API credits in your account. |
Managing subscription plans
CreatorDB offers a 14-day free trial for the Pro Plan that is only effective once. Once the free trial period is over, you will switch to the paid Pro Plan. You can upgrade to other tier plans, such as Premium or Enterprise, if you need more features. Each tier plan offers different quotas for accessing database features. You can upgrade or downgrade your subscription plan anytime through the CreatorDB platform and view all service quota usage.
Upgrading a subscription plan
When you upgrade your CreatorDB subscription plan, it will take effect immediately.
-
Log in to CreatorDB.
-
Click on your profile image.
A drop-down menu appears.
-
Click Learn more→.
The Select your plan page appears.
-
Enable monthly or yearly billing.
-
Click Upgrade.
A confirmation message appears.
-
Click Upgrade.
Downgrading a subscription plan
When you downgrade your CreatorDB subscription plan, it will take effect in the next billing cycle.
-
Log in to CreatorDB.
-
Click on your profile image.
A drop-down menu appears.
-
Click Learn more→.
The Select your plan page appears.
-
Enable monthly or yearly billing.
-
Click Downgrade.
A confirmation message appears.
-
Click Downgrade.
Canceling a subscription plan
-
Log in to CreatorDB.
-
Go to Settings > Current plan.
-
Click Current plan.
-
Click Cancel.
A confirmation message appears.
-
Select Cancel plan.
-
Click Cancel.
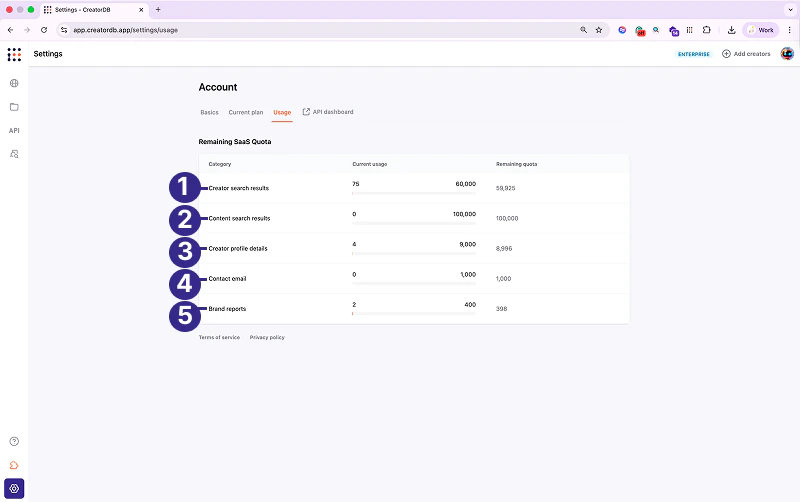
Viewing SaaS quota usage
Your SaaS quota depends on your subscription tier. For details, see Pricing plans. | No. | Label | Description |
|---|
| 1 | Creator search results | Shows the number of creator searches you’ve made and the remaining searches available. |
| 2 | Content search results | Shows the number of content searches you’ve made and the remaining searches available. |
| 3 | Creator profile details | Shows the number of creator profiles viewed and the remaining ones available. |
| 4 | Contact email | Shows the number of creator contact emails obtained and the remaining retrievable emails. |
| 5 | Brand reports | Shows the number of brand reports obtained and the remaining reports available. |
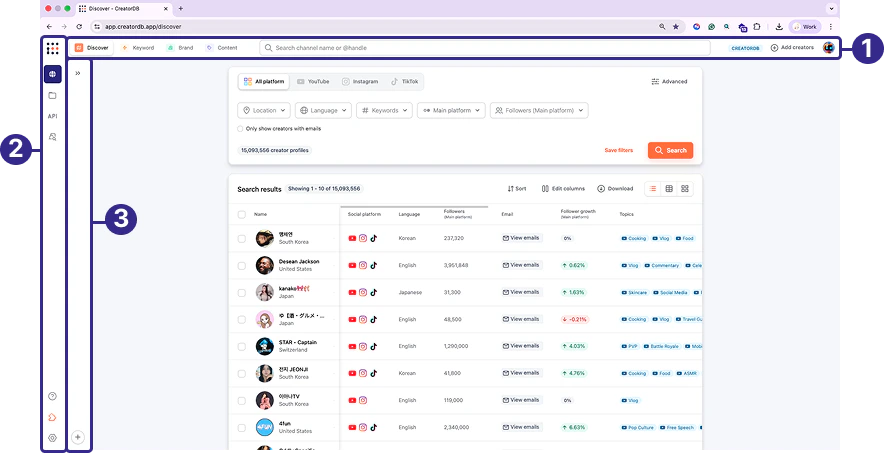

.png?fit=max&auto=format&n=W-4rWHs9LdhrgkZ1&q=85&s=989937518ada5da7b539dbc47e834581)
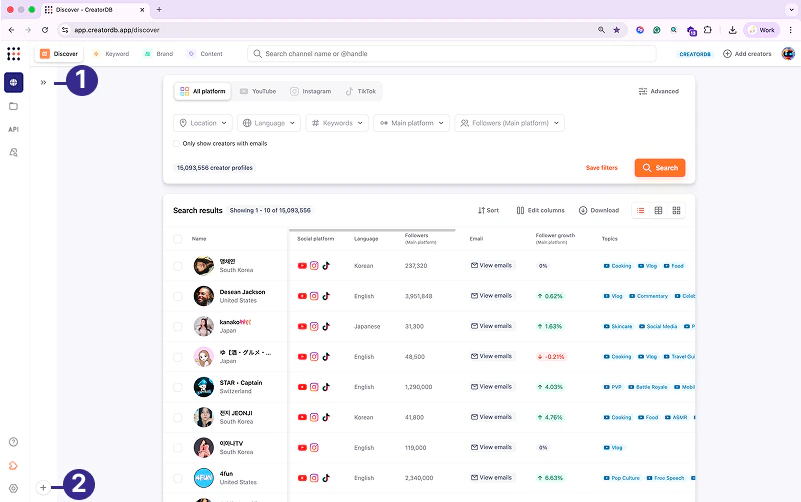
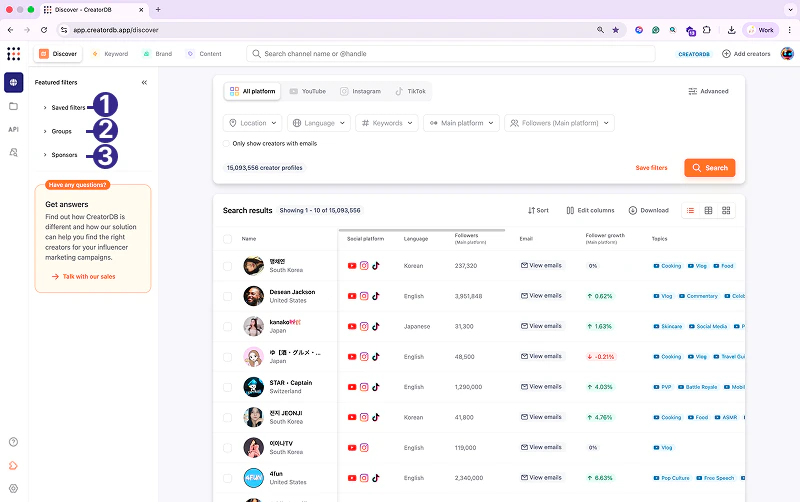
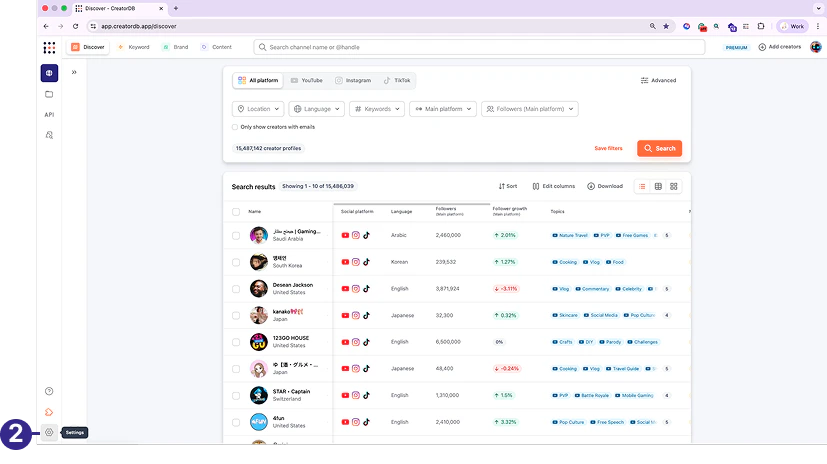
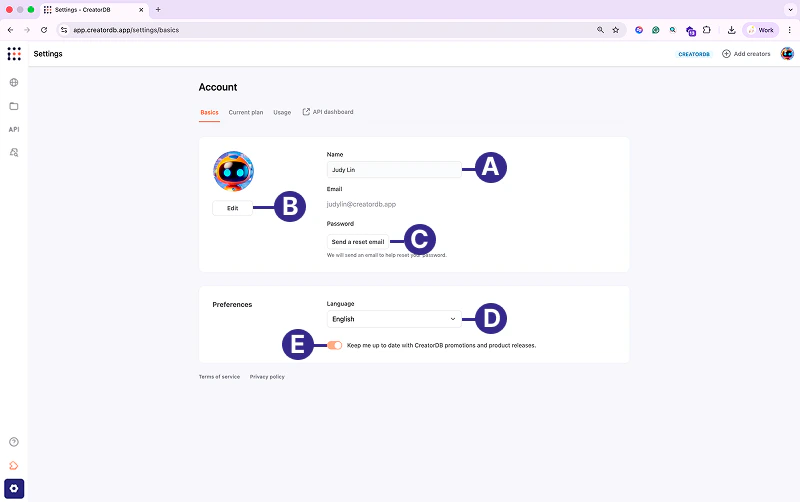
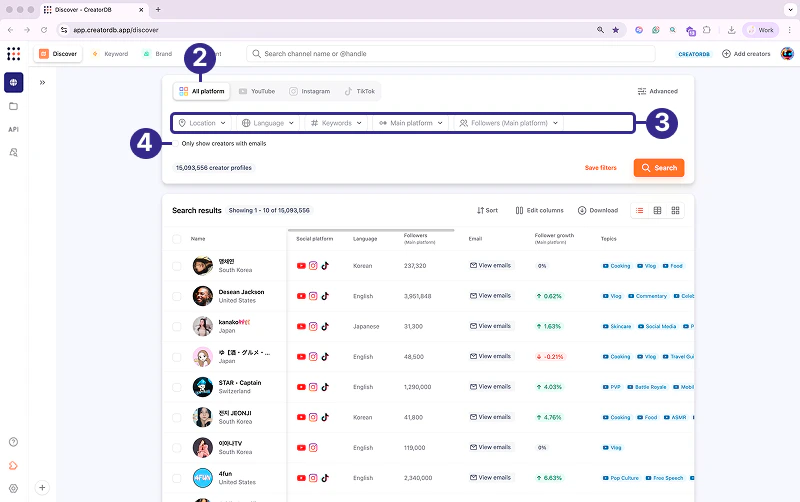
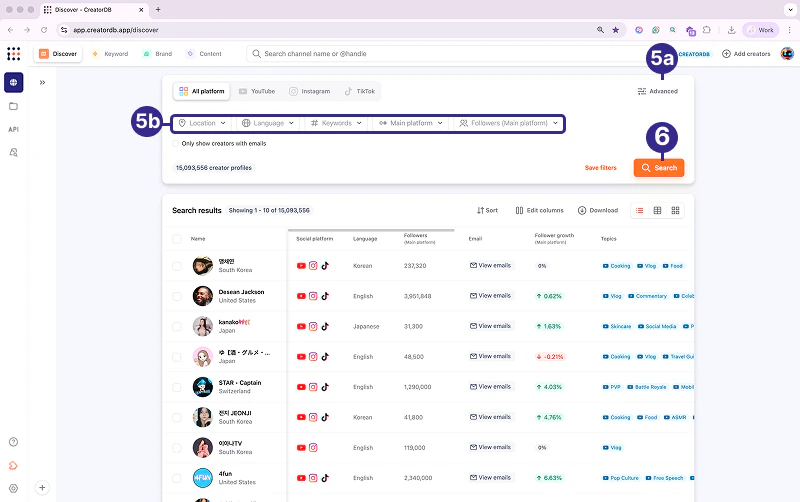
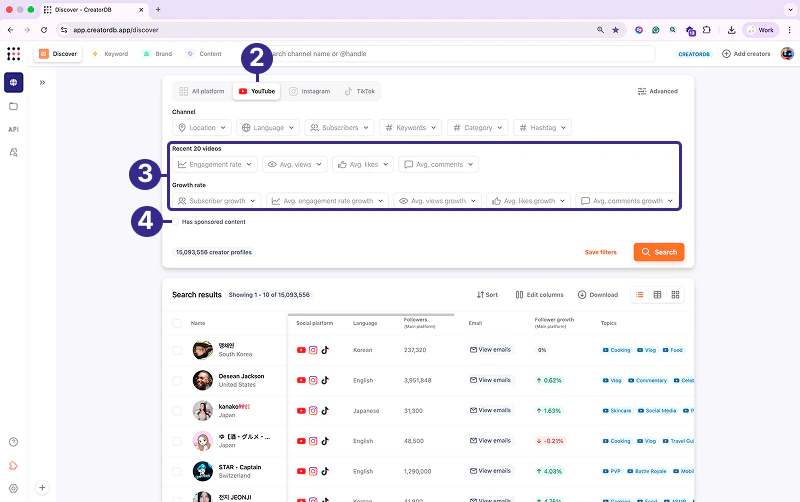
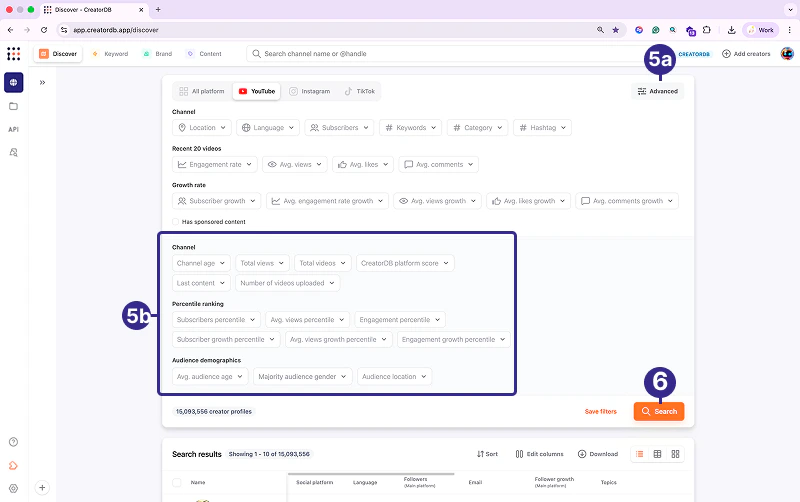
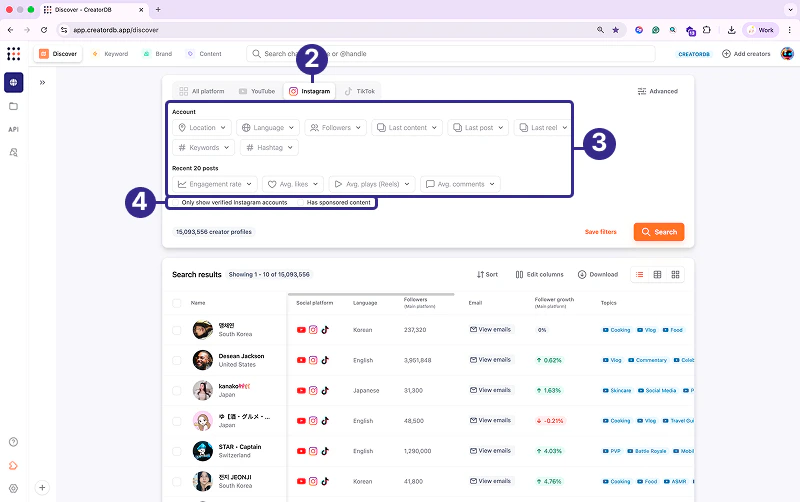
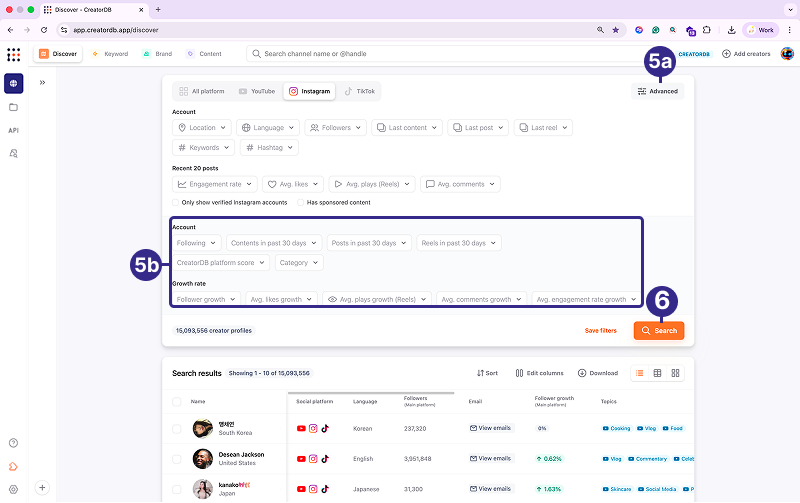
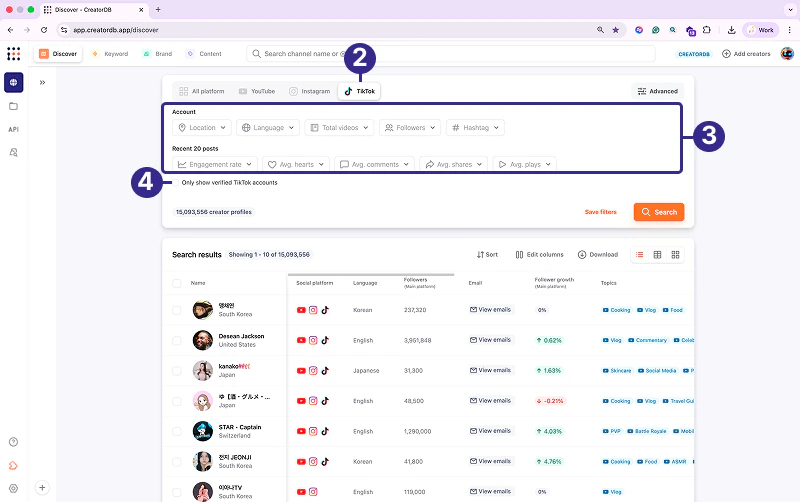
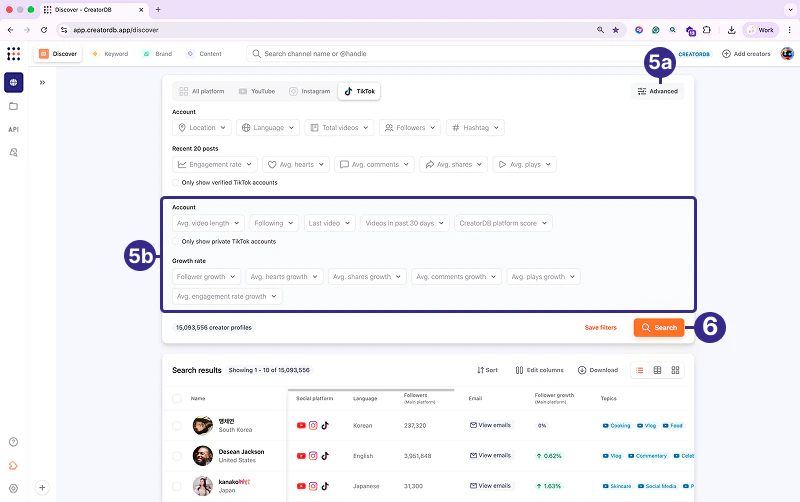
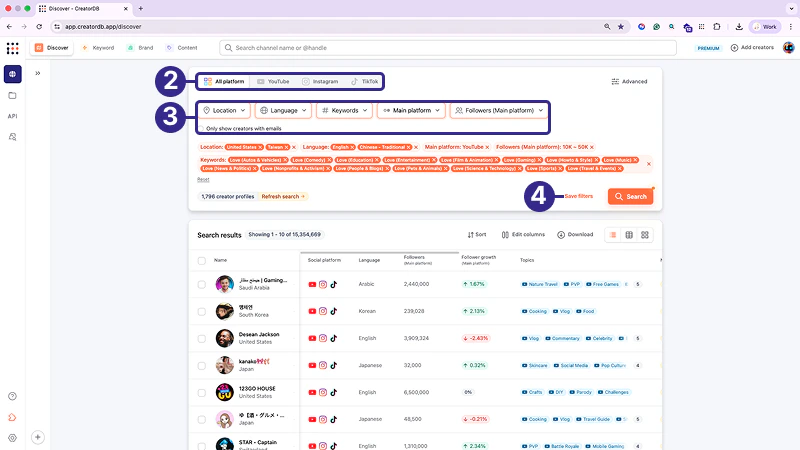
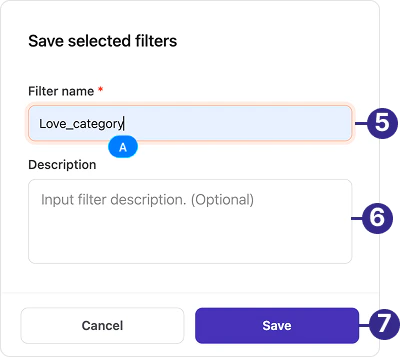
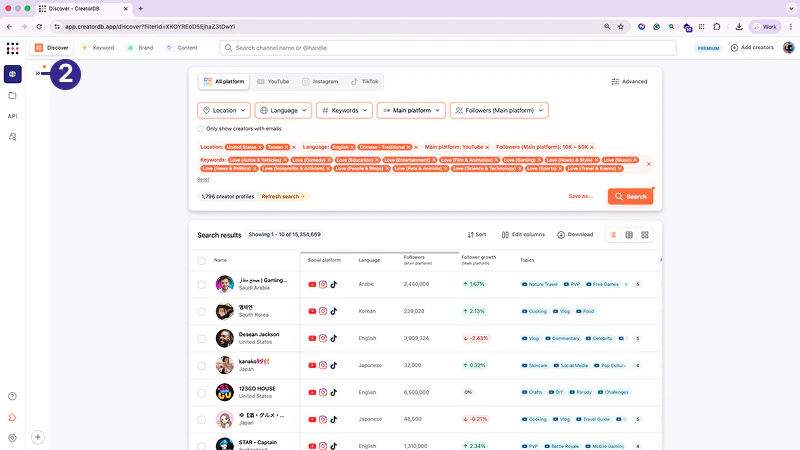
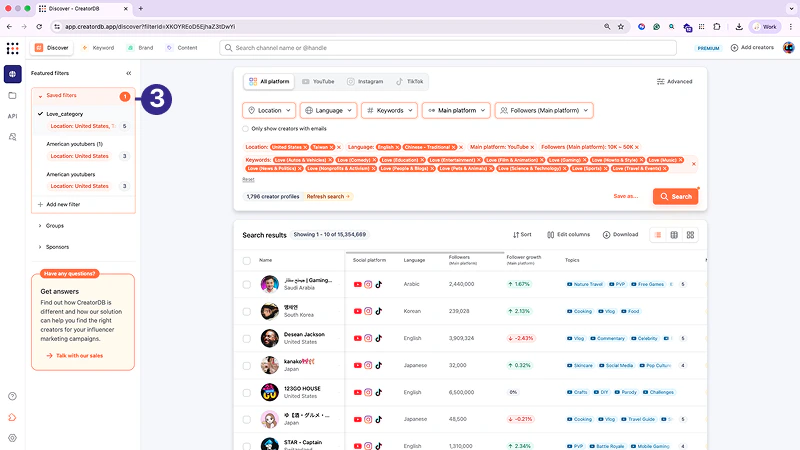
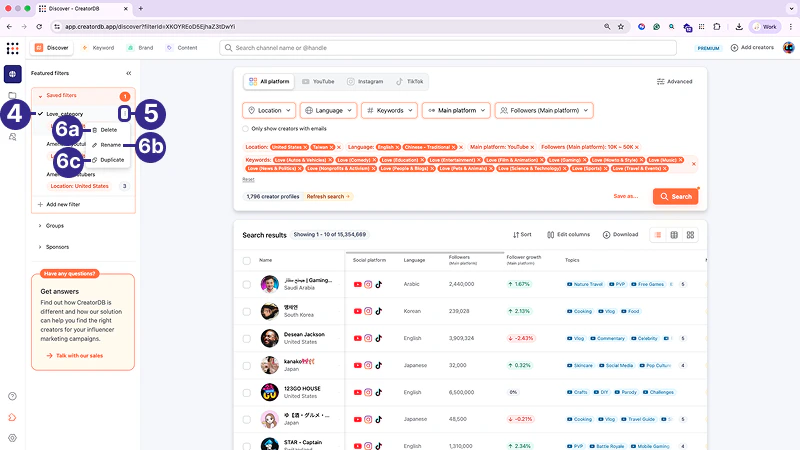
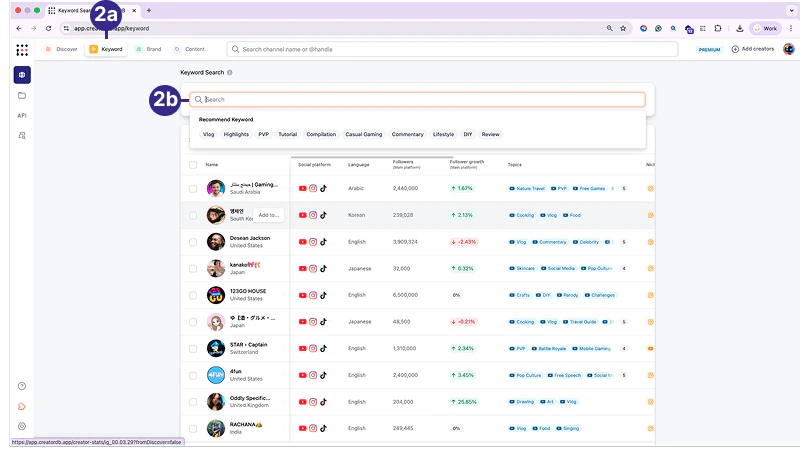
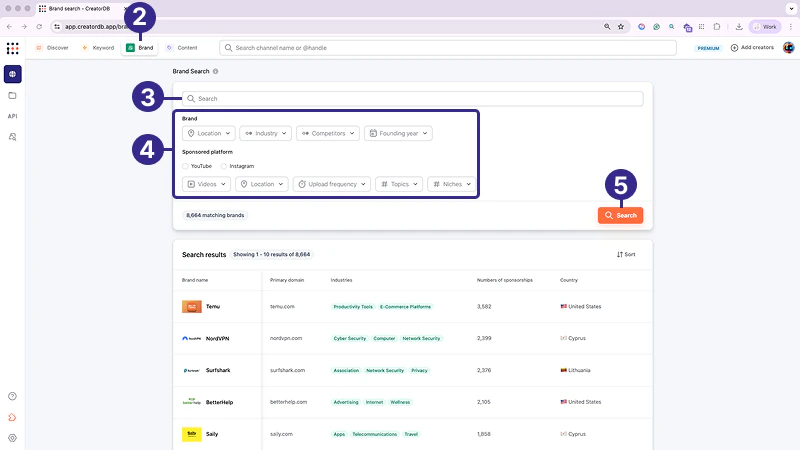
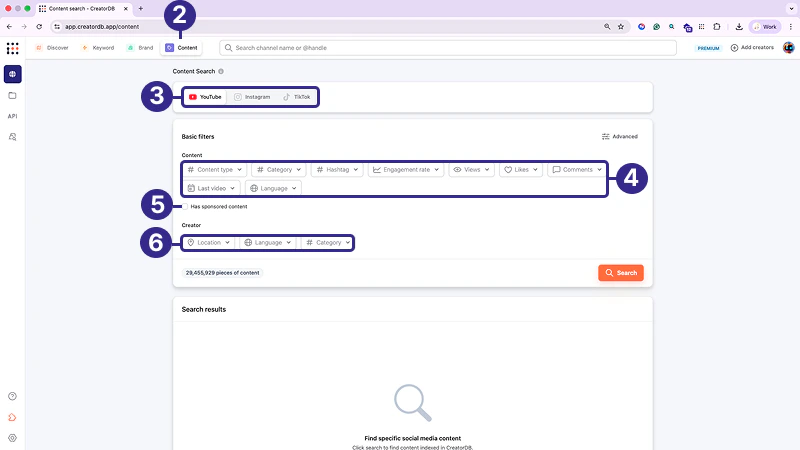
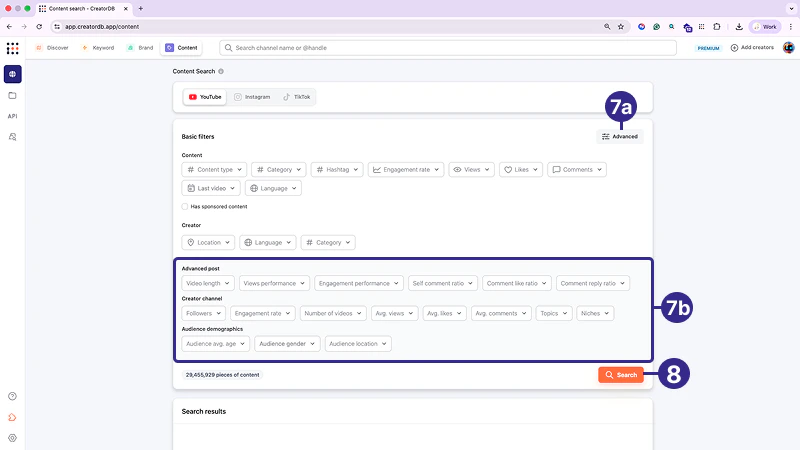


.png?fit=max&auto=format&n=W-4rWHs9LdhrgkZ1&q=85&s=ea7030de1b1c2bc2f175e5d91d051408)


.png?fit=max&auto=format&n=W-4rWHs9LdhrgkZ1&q=85&s=f8c33d9e0f1b6e39a723b4022e604c64)


.png?fit=max&auto=format&n=1qbXt1aF4MuKbg8e&q=85&s=caed35b9dac2a8ae4ba0e220bccec17a)


.png?fit=max&auto=format&n=W-4rWHs9LdhrgkZ1&q=85&s=3c5c7dd21bd1bd71738588c980156a49)
.png?fit=max&auto=format&n=W-4rWHs9LdhrgkZ1&q=85&s=7563ee48706259f54c05751435adb6ce)


.png?fit=max&auto=format&n=tPfeW1gU63YBlmpo&q=85&s=0871edfb93703b4b070d0910f10505e4)


.png?fit=max&auto=format&n=tPfeW1gU63YBlmpo&q=85&s=1e637edc24da1be4e9d246144893e3d9)


.png?fit=max&auto=format&n=M0s7g-bE8-r_Bv1t&q=85&s=c8ebda22051d73ed35d666d20d9c5dbb)


.png?fit=max&auto=format&n=M0s7g-bE8-r_Bv1t&q=85&s=73439071dd4eca10791eb071504c4200)

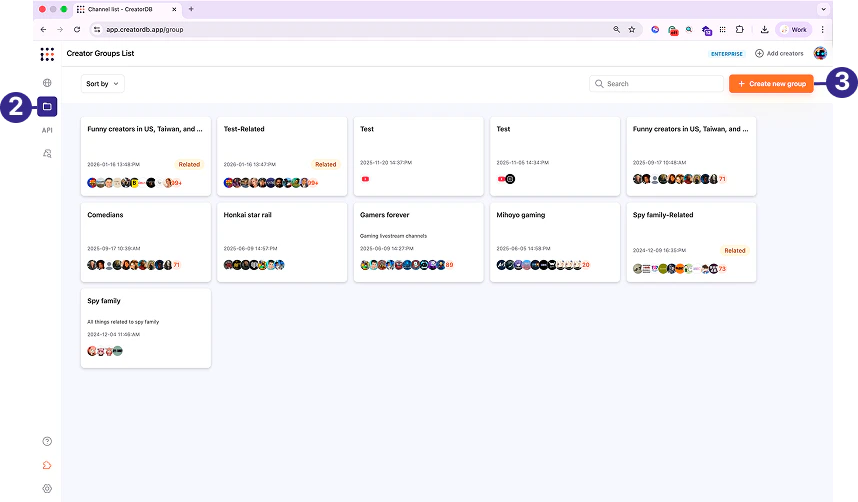
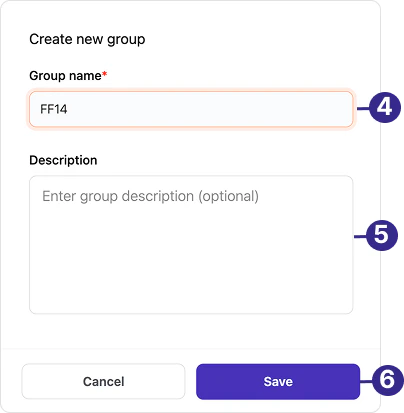
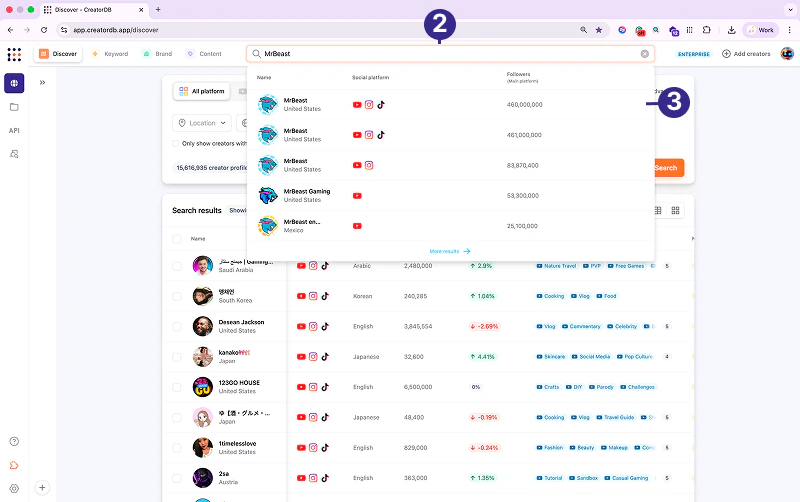
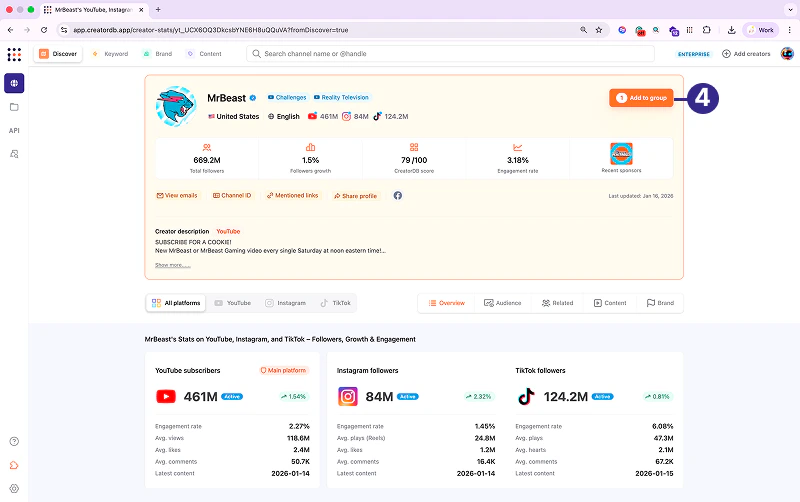
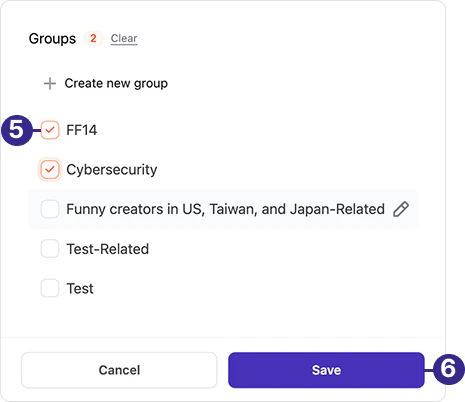
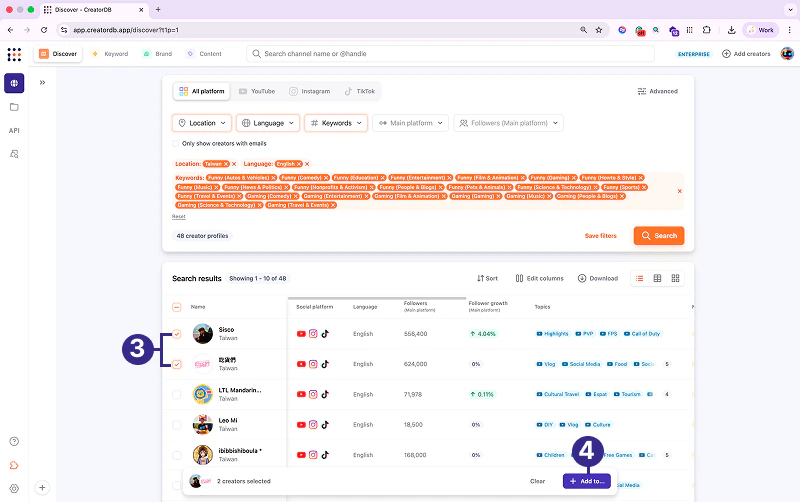
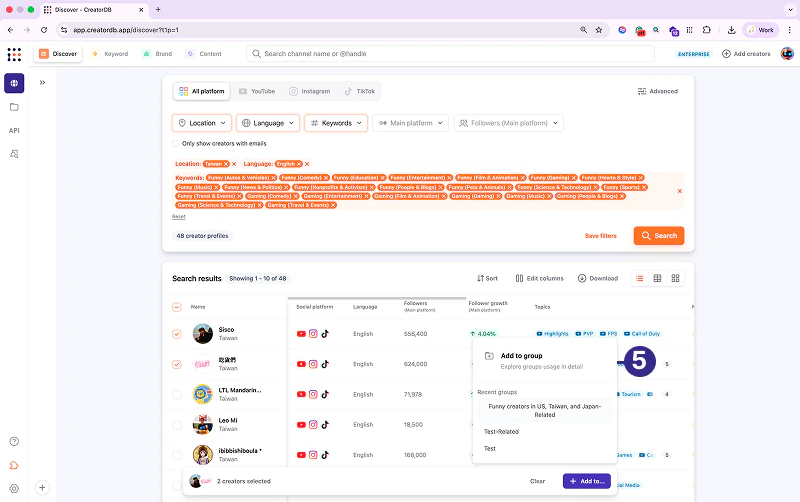

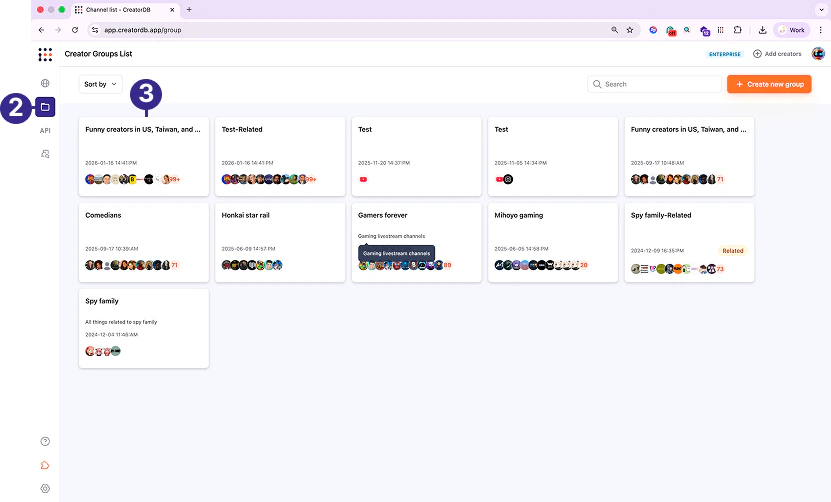
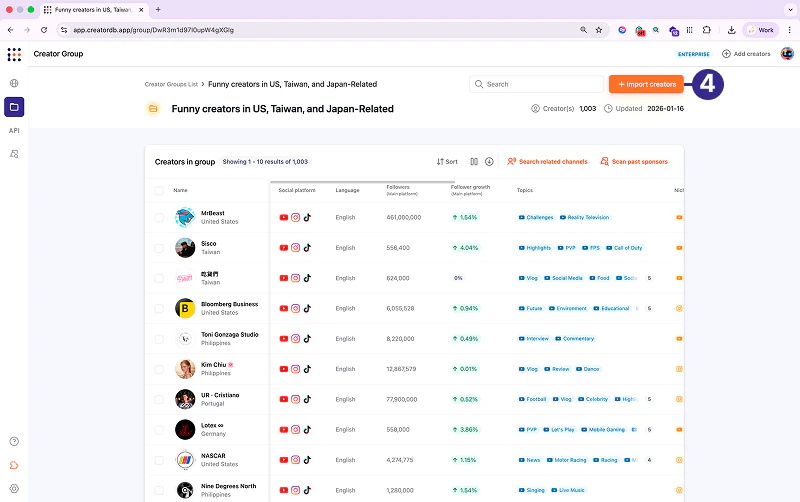
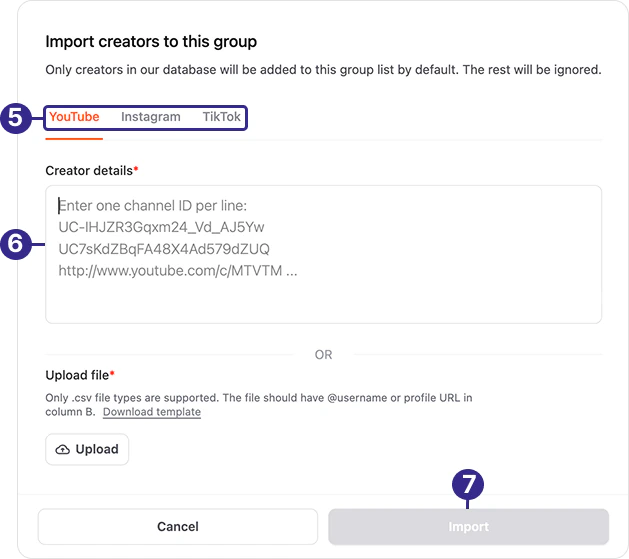
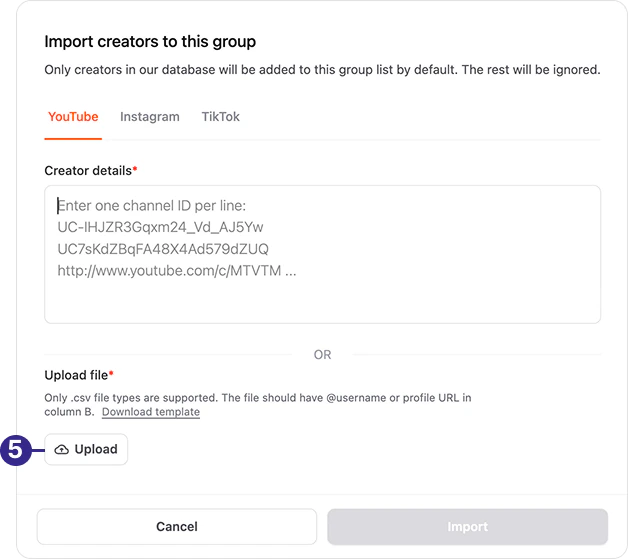
.png?fit=max&auto=format&n=M0s7g-bE8-r_Bv1t&q=85&s=dac9447d79168fb643f00054ac020292)
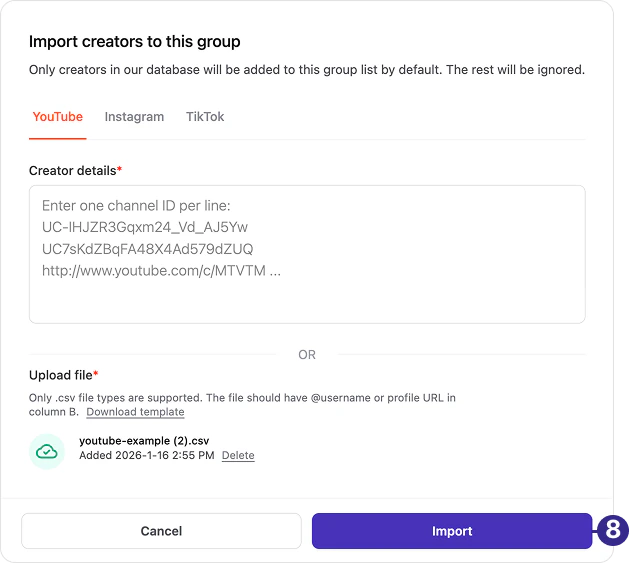
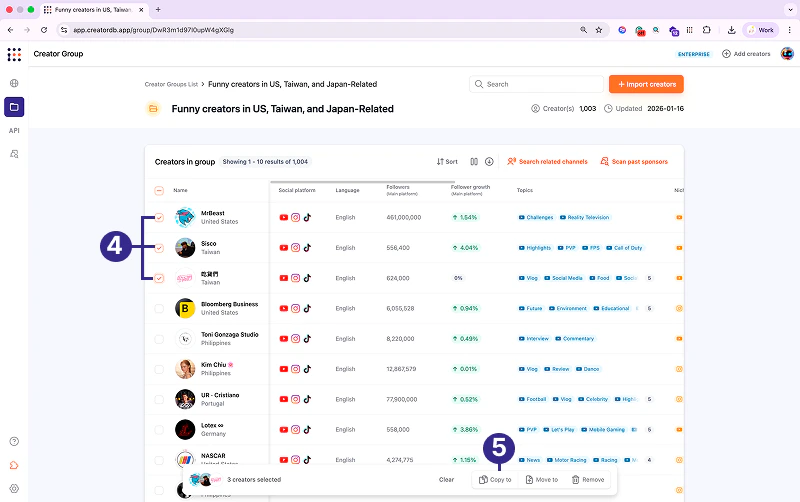
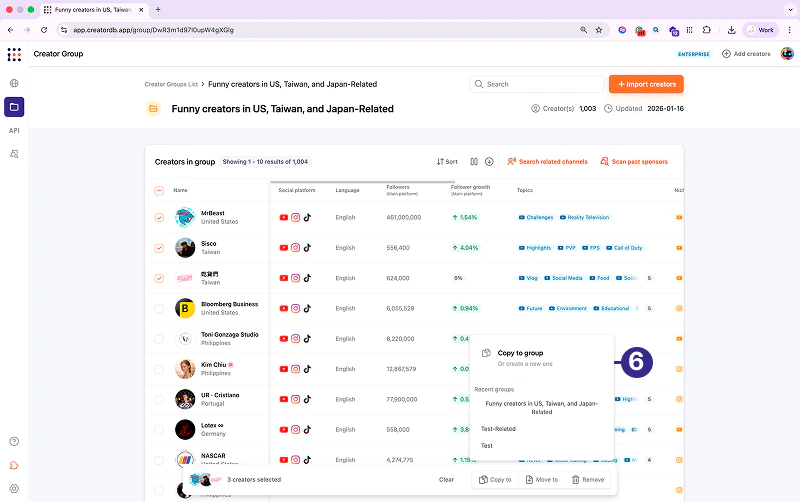
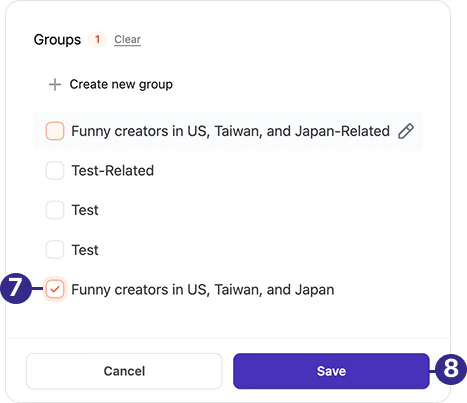
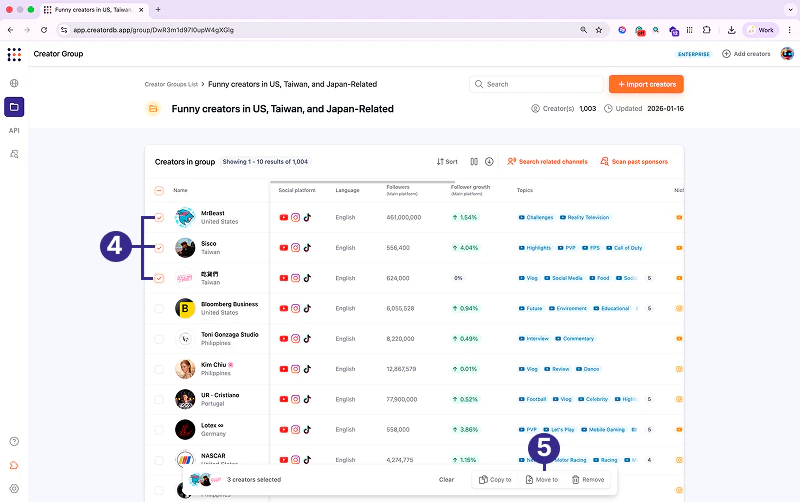
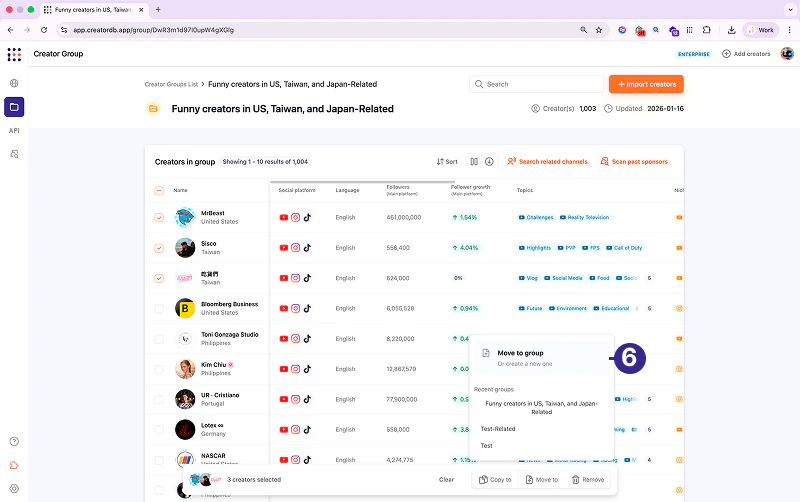
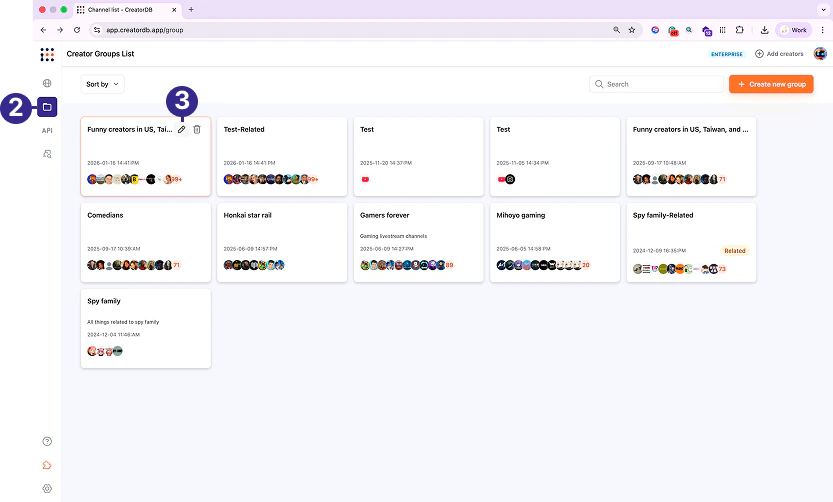
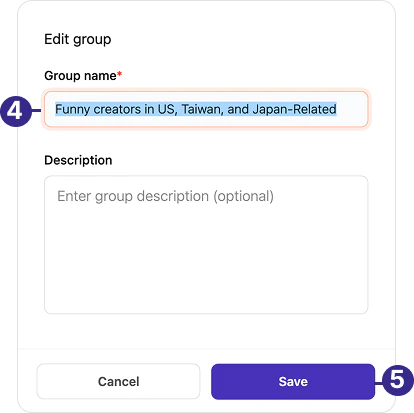
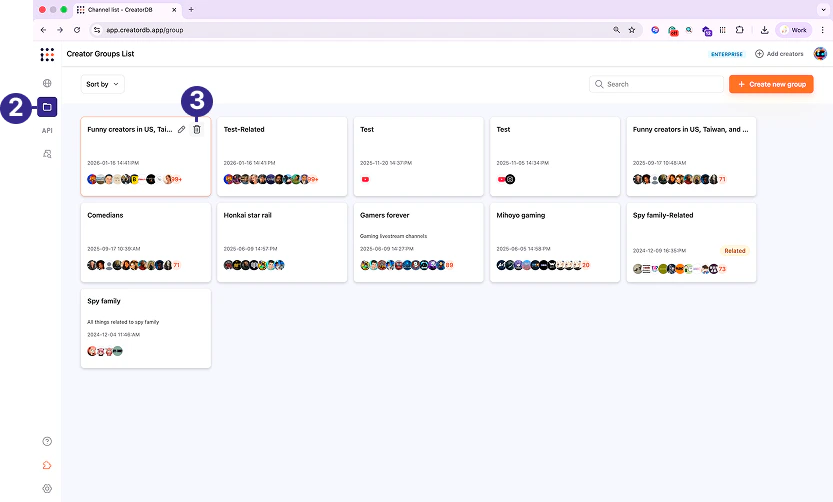
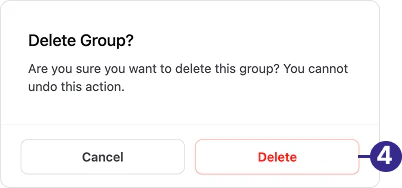
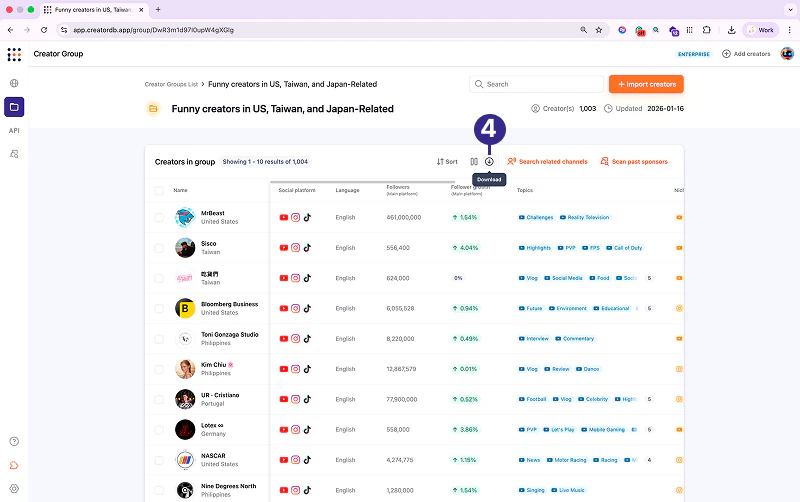
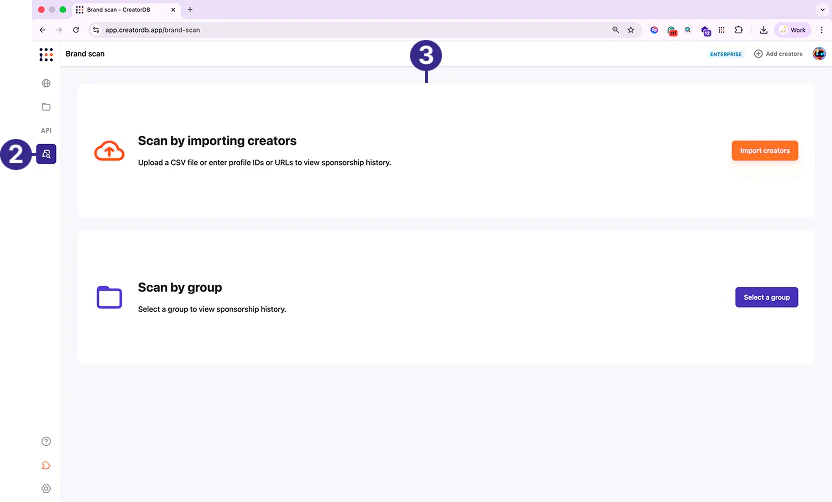
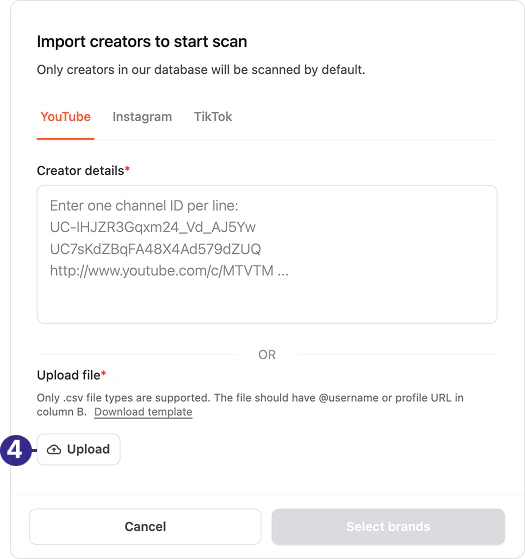
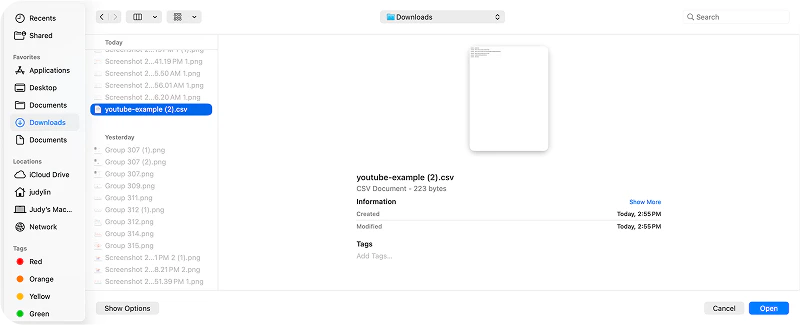
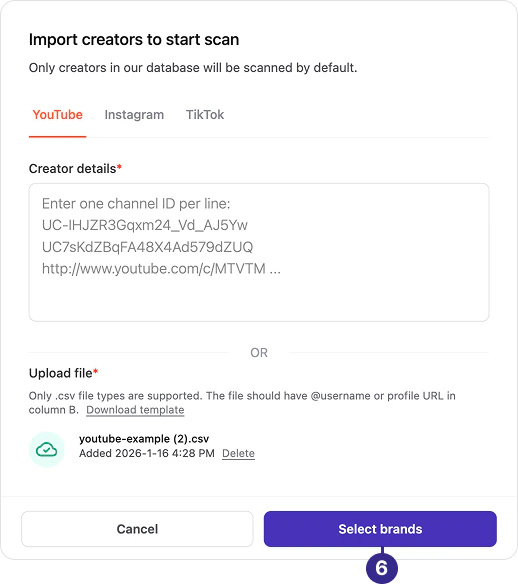
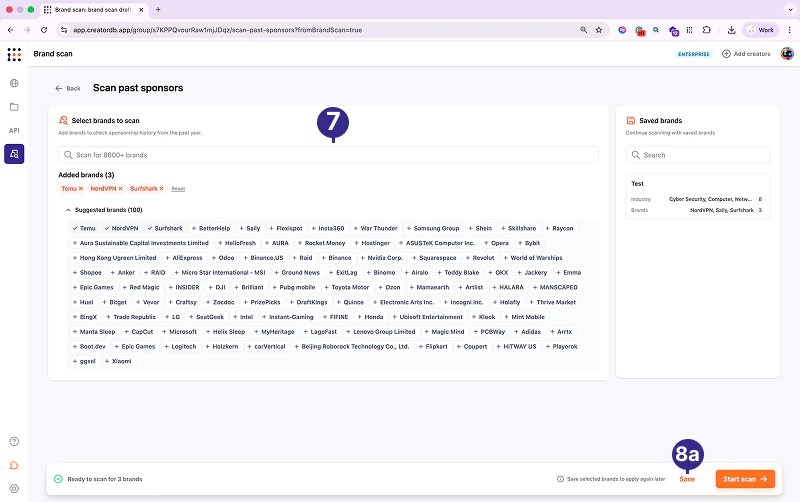
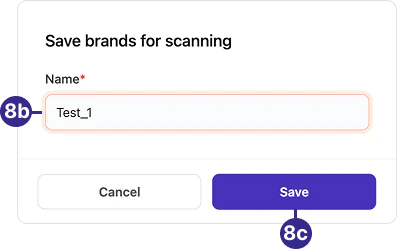
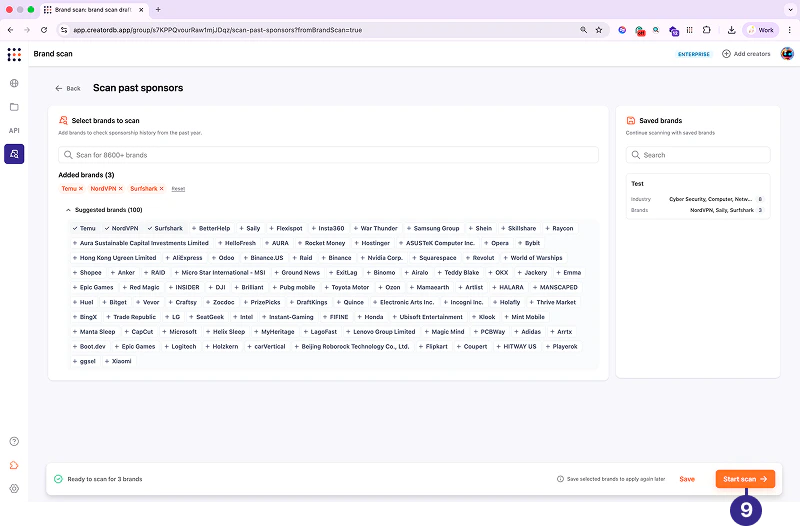
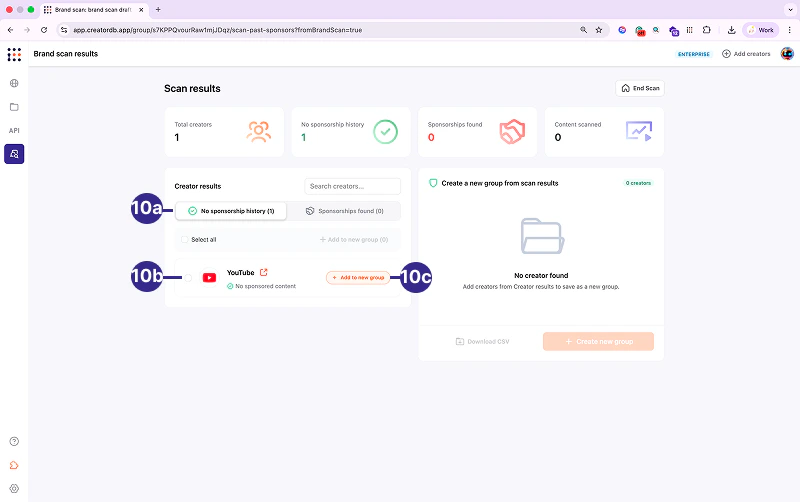
.png?fit=max&auto=format&n=M0s7g-bE8-r_Bv1t&q=85&s=2efb1474525dda1115723e749ac78206)
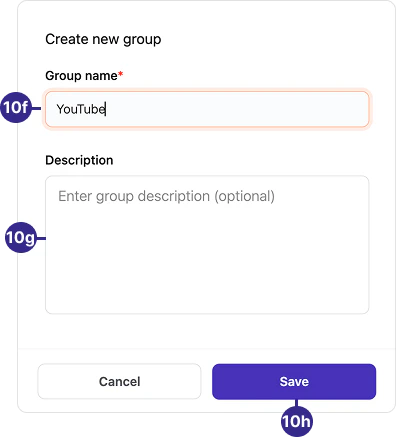
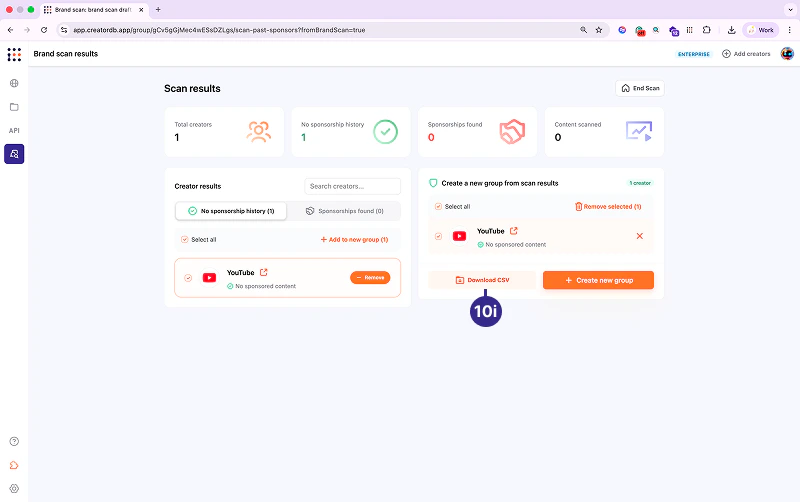
.png?fit=max&auto=format&n=M0s7g-bE8-r_Bv1t&q=85&s=9f096e27801a626317977668808d1d6f)

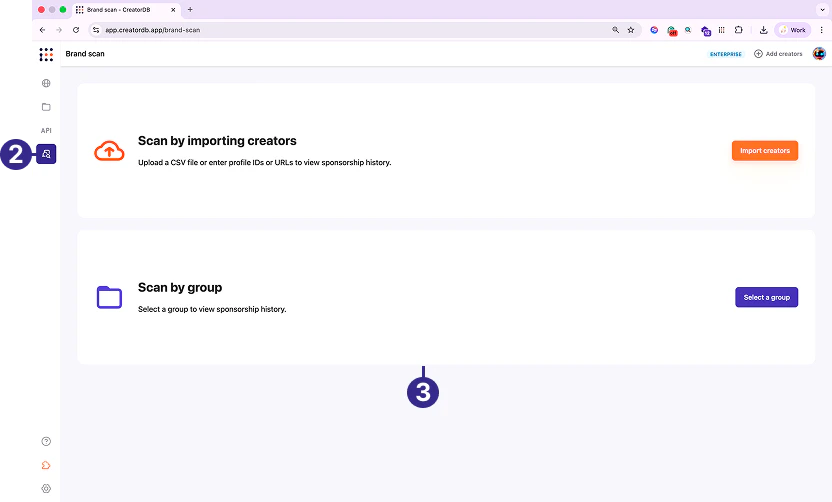
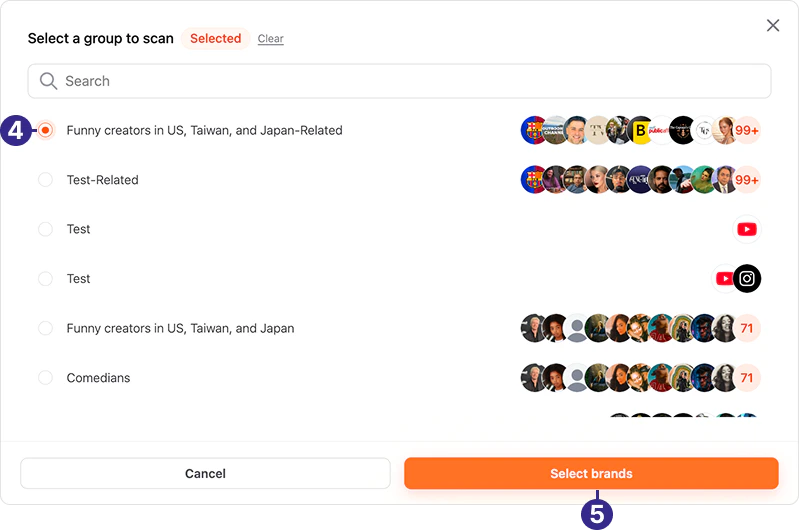
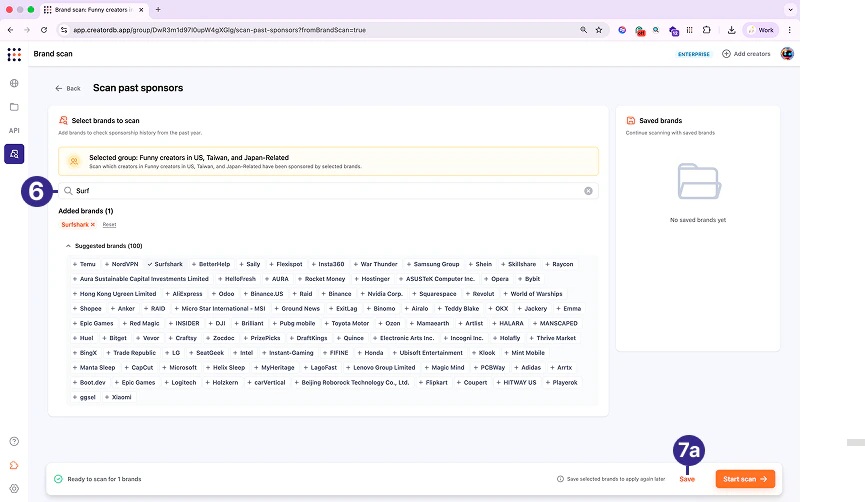
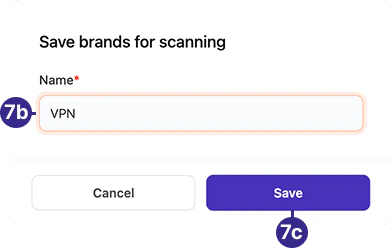
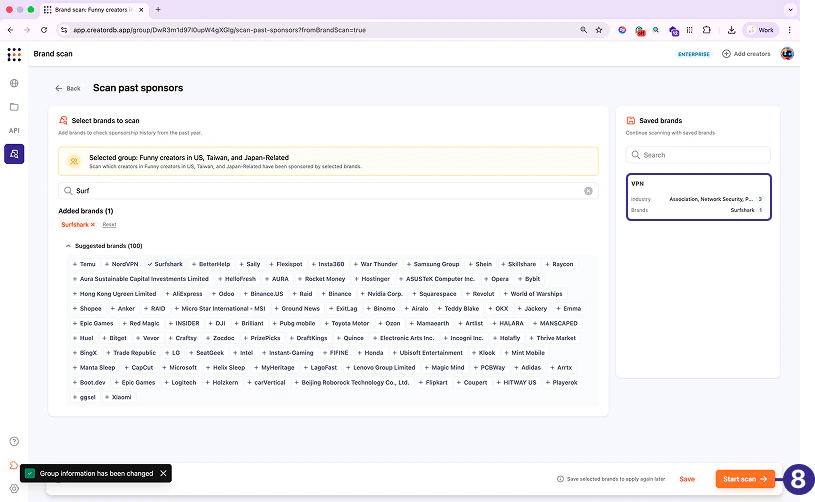
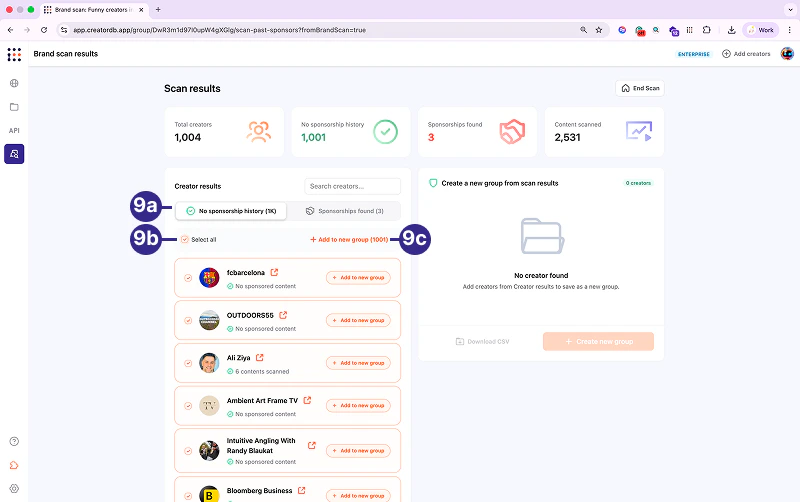
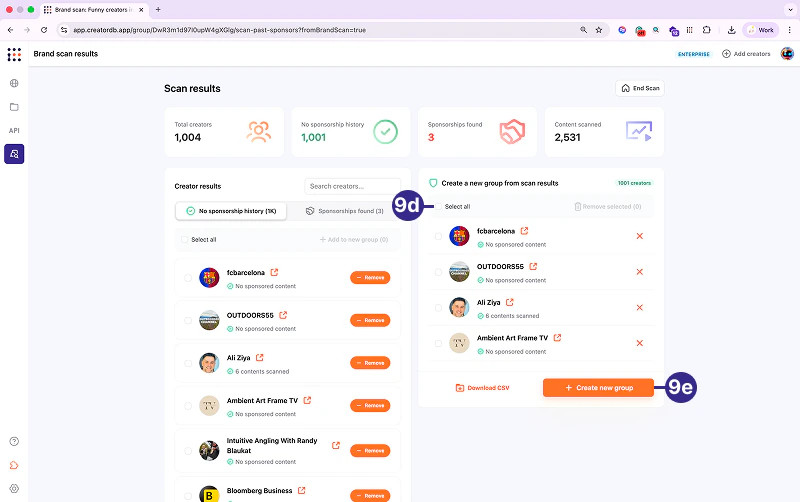
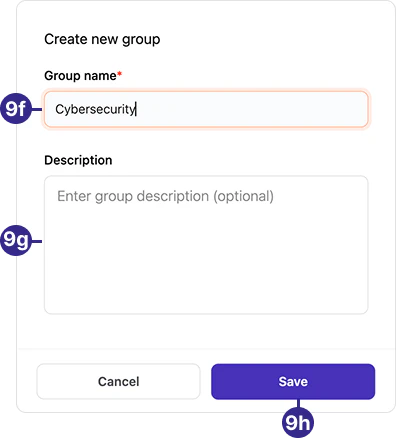
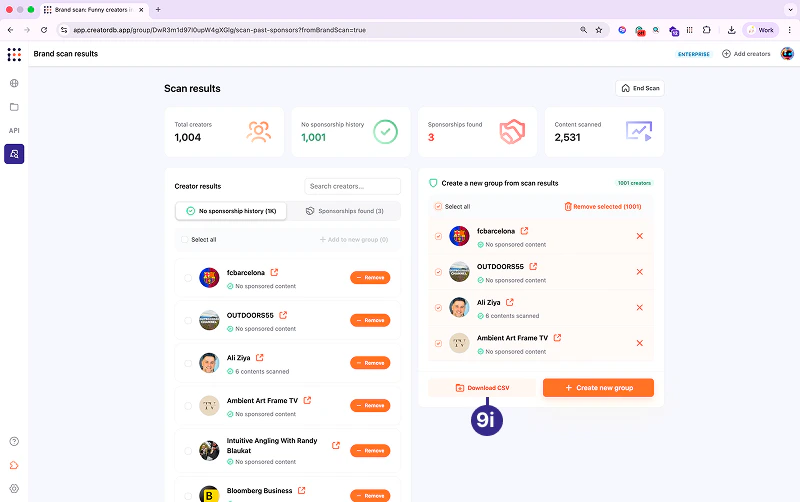
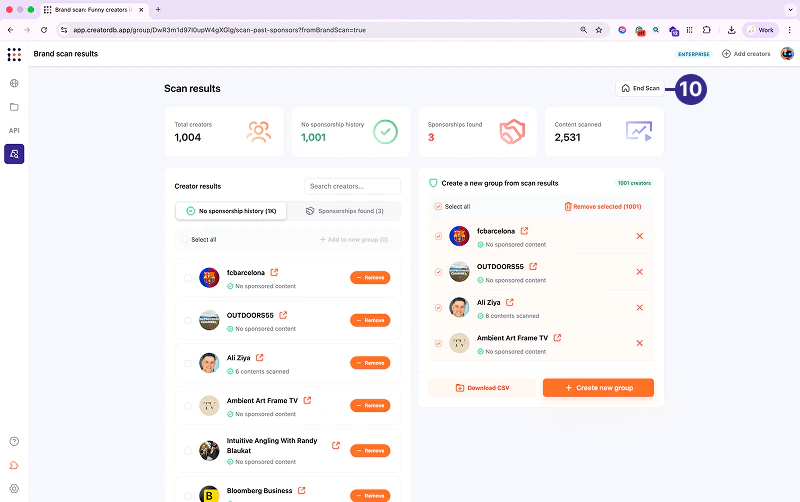
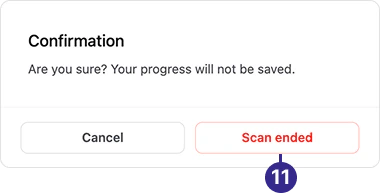
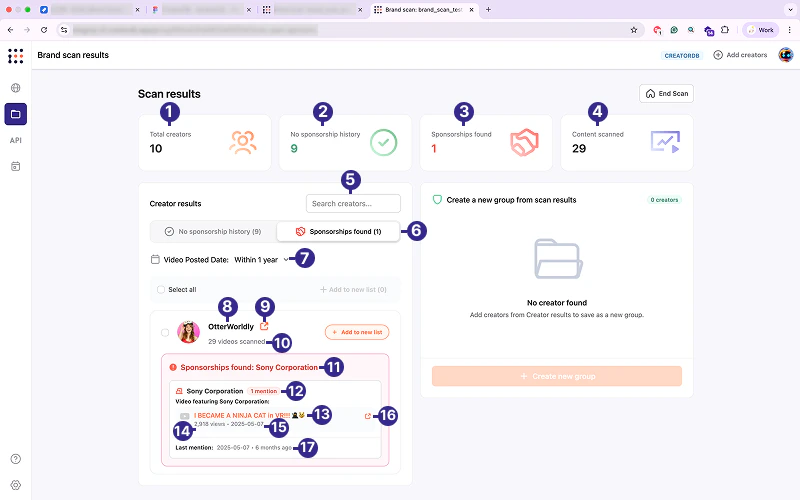


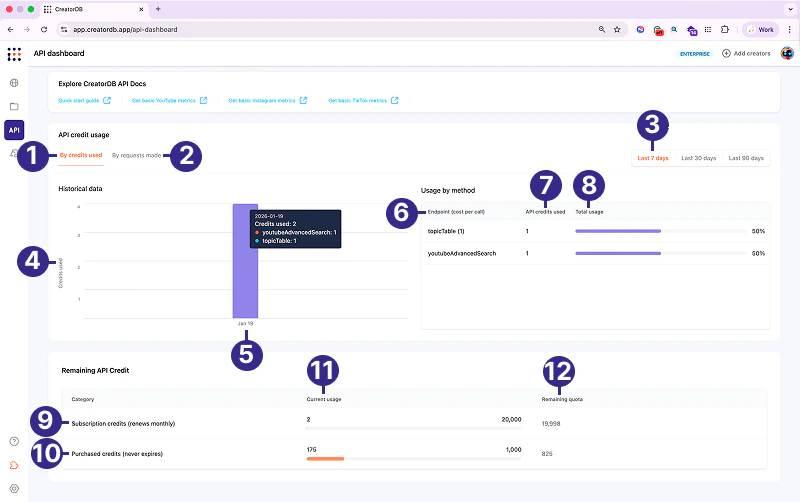
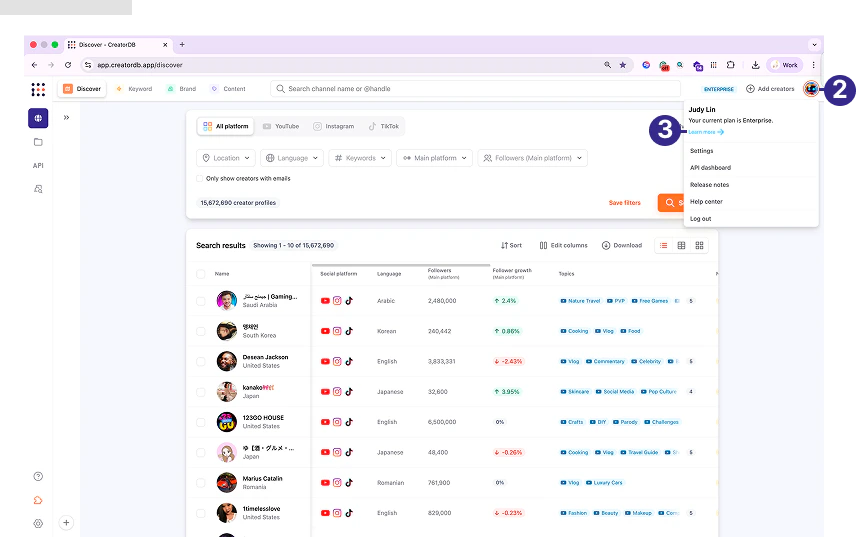
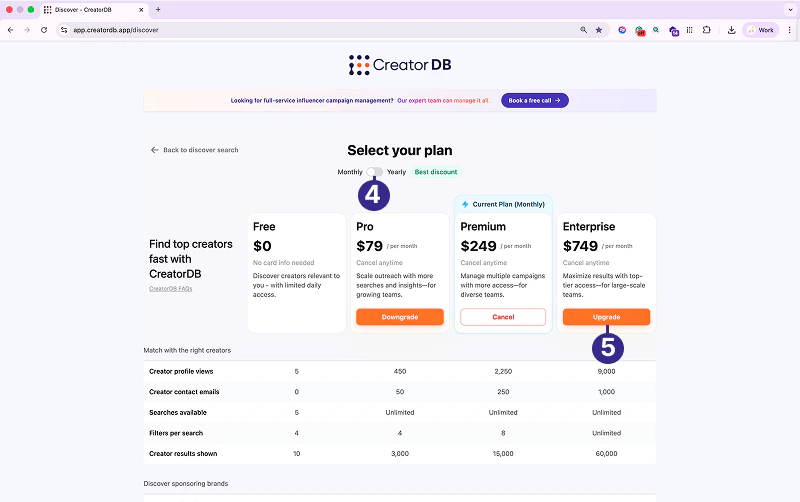
.png?fit=max&auto=format&n=1qbXt1aF4MuKbg8e&q=85&s=ae22fb5722085a2c389d3f906686b6ce)
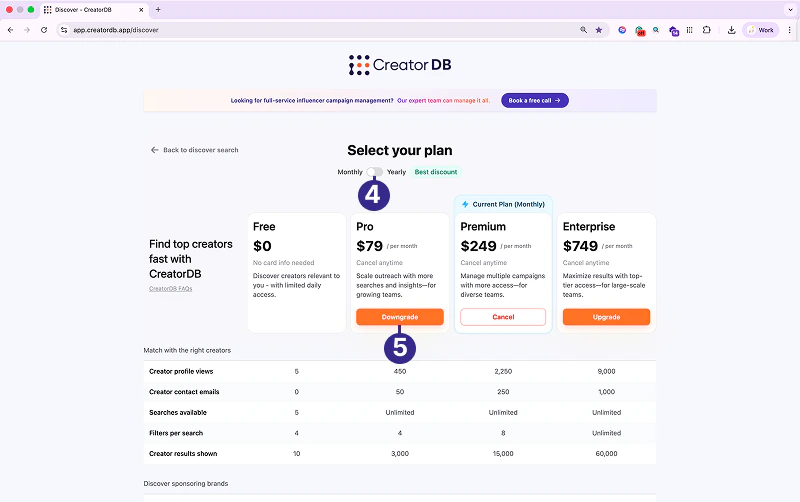
.png?fit=max&auto=format&n=1qbXt1aF4MuKbg8e&q=85&s=711122b1aeacb1fad462f9baa22dfff4)
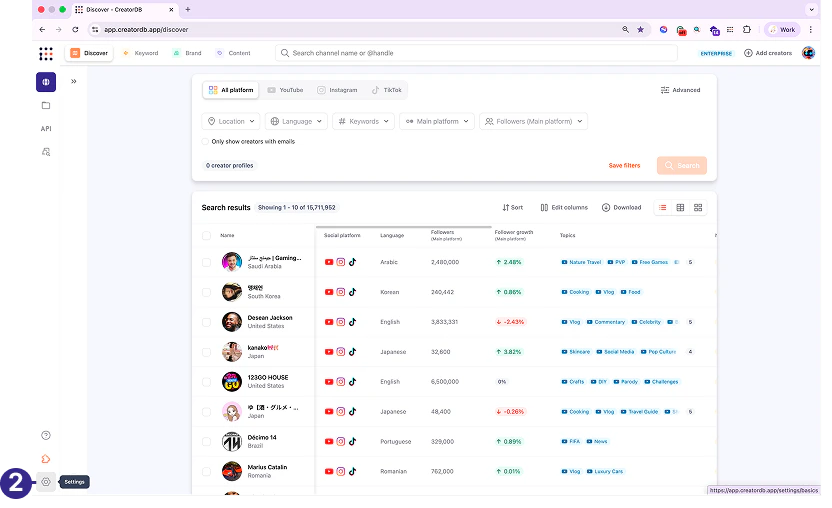
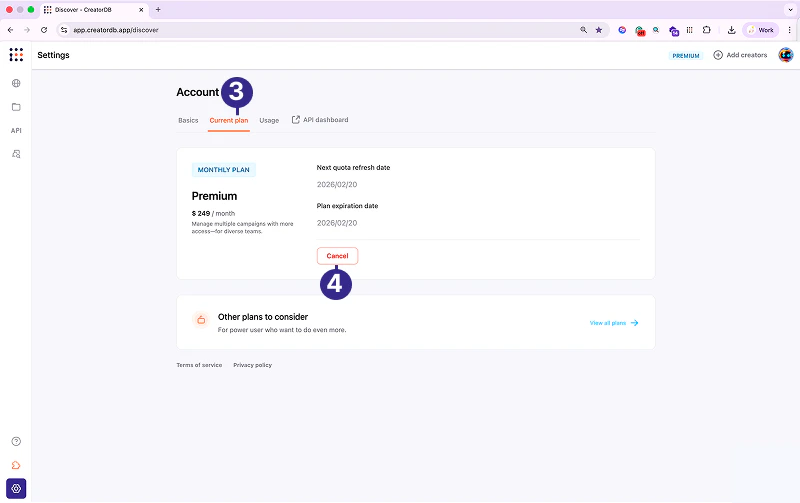
.png?fit=max&auto=format&n=1qbXt1aF4MuKbg8e&q=85&s=ac966fb055046c039d095ef3a52e388c)